Sales reports
Dig deeper into your new leads, closed won deals, lost deals and more.

“Nutshell is super user-friendly and intuitive
“I would highly recommend Nutshell
“Easy to use and... wait for it ... 100% buy in!
“Nutshell is both simple and powerful
Measure what matters.
Create, save, share and download reports instantly in Nutshell.
Start 14-day free trial Book free demo
🎉 No credit card required!

Save, share and download any Nutshell report. All reports use Nutshell’s powerful filtering capabilities. Filter by tags, custom fields, pipeline, outcome, a specific date range and so much more.

Dig deeper into your new leads, closed won deals, lost deals and more.

Report on your team’s efforts like Activities, Emails and Tasks.

Measure the effectiveness of your email campaigns, form fills, web traffic and more.

Measure how your live chat and chatbot help with website conversions and sales.

Estimate your future sales based on the value of the leads in your timeline.

Quickly identify which stages in your sales process you’re closing the most leads – or losing them.

Create your own custom reports with Nutshell’s powerful filters

Ask Nutshell AI to create reports for you.
Gain a crystal-clear view of your revenue health with real-time insights that help you predict your trajectory and close more deals.
 Drill down to all of your New Leads, Won Leads or Lost LeadsPredict future revenue with precision using our Forecast reportUnderstand where you’re getting your best Leads and Customers with our Lead attribution reportCreate custom reports to see exactly what you need.
Stop guessing who is doing the work and start seeing the “hustle” behind every win with real-time visibility into your team’s daily activity.
 Activity report: track your team’s productivity and how they’re preforming against their quotaEmail report: measure the volume and different types of email outreach from your teamTask report: breaks down team productivity related to automated tasks so you can see which ones are on time, late, skipped or incomplete.
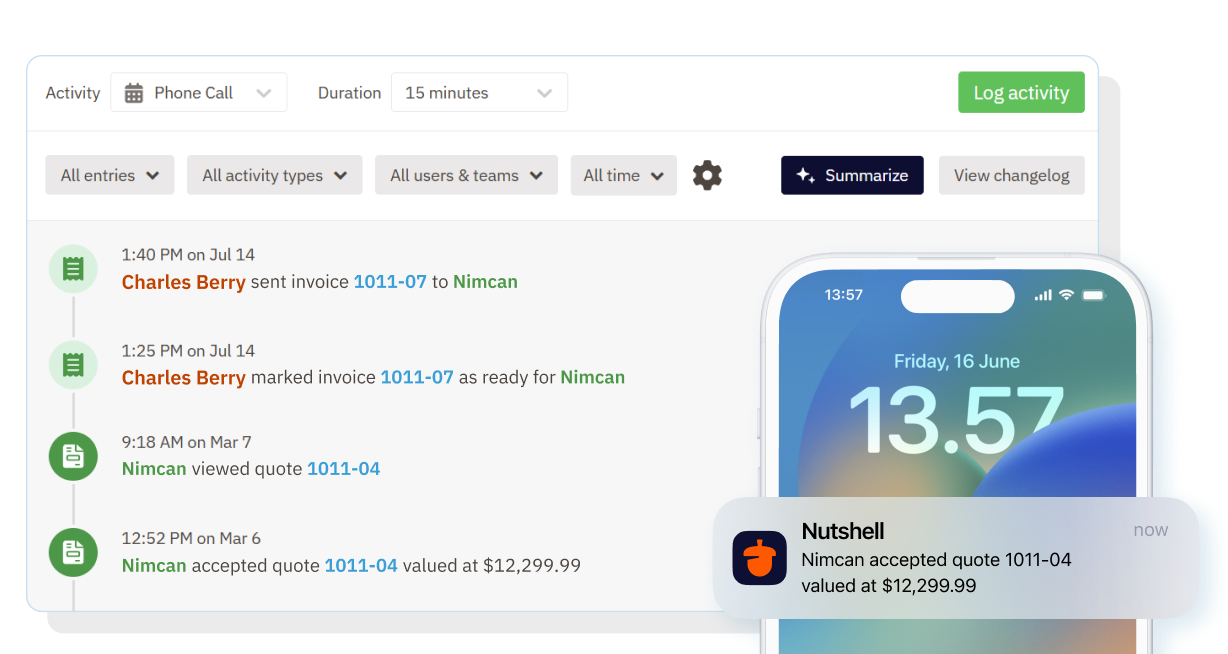
Connect your marketing efforts to your bottom line.
 Monitor website traffic by adding the Nutshell pixel to your websiteTrack deliverability, open rate, click rate and who actually clicks what linkTrack Landing page visits and Form submissions and conversion ratesKeep a pulse on the market by tracking your Competitors’ web traffic
Understand how tools like Chat, Chatbot and Scheduler are impacting your bottom line.
 See the overall conversion rate of your Live chat and connect real life salesDiscover trends on how visitors are using your Chatbot and how effectively your Chatbot answers questionsUnderstand your team’s availability and how that impacts total meetings booked with our Scheduler report
Estimate your future sales.
 Show the full value of leads in your pipelinesAdjust your calculations by lead confidence levelChange the date range to include previous weeks, months, quarters or years to see how your forecast has historically aligned with your actual sales.
Learn more about your pipeline performance and conversion rates.
 Filter by funnel, date range, assignee, tags, sources, competitors, and productsToggle between Lead quantity and Lead valueQuickly identify which stages in your process your team is winning (or losing) the most leads.
Create the exact report you need.
 Add filters for any data points in your Nutshell accountSegment your report on outcome, product, assignee, territory, source, tag, competitor, or stageDefine your date range and compare to previous periods
Chat with Nutshell’s Smart reports or connect to your favorite GPT
 Tell Nutshell’s smart reports what you want to build and sit backNutshell’s MCP server lets you connect your data to ChatGPT,Claude and more for deep insightsGet daily or weekly summary reports sent directly to your inbox
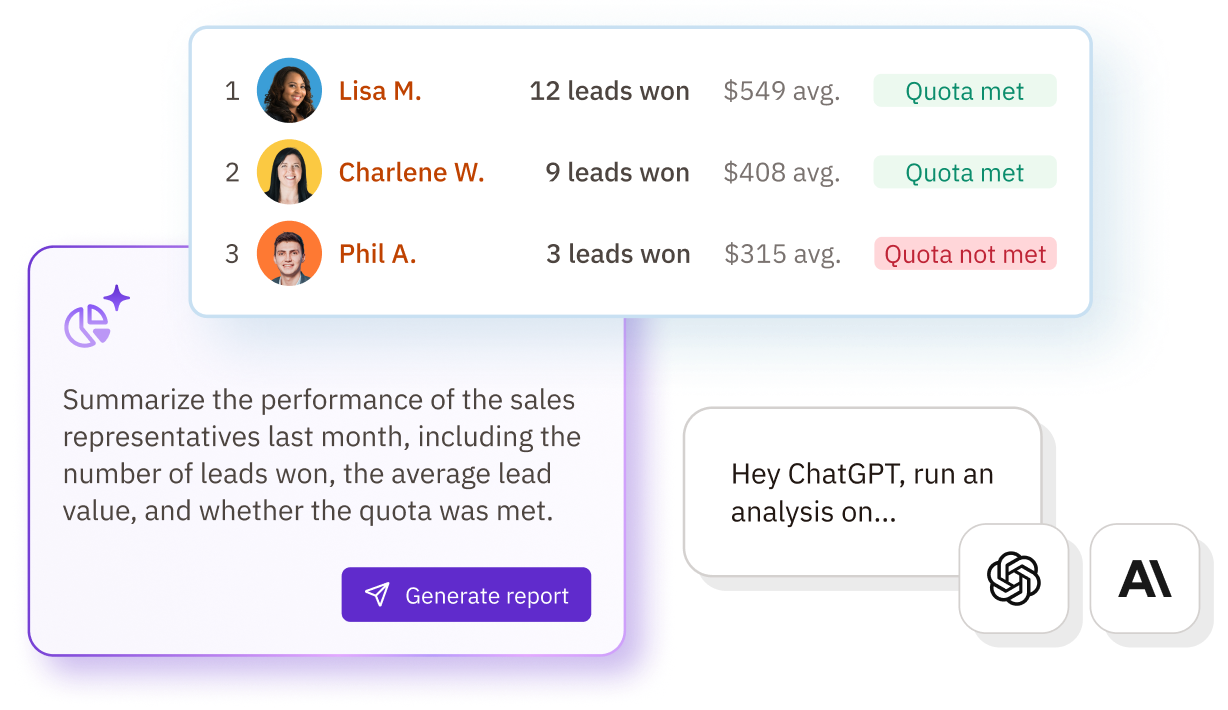
Try Nutshell (including Quotes & Invoices) free for 14 days or let us show you around before you dive in.
🎉 No credit card required!

A CRM report is an analytical report done using data from a CRM system. Because CRMs help sales teams organize, track, and manage their leads and sales, they are valuable databases of information about sales, losses, leads, activities, and more. A CRM report can provide insights into:
Running a CRM report in Nutshell is as simple as selecting your filters and watching the data populate. All Nutshell reports allow you to choose from a set of standard filters as well as your own custom fields so you can dive into the data that matters most. Then, simply select a date range, and Nutshell will present the data automatically in an easy-to-read bar or line graph that’s ready to be downloaded and shared.
The best sales reporting tools will provide your team with features that help you break down your sales data into actionable insights. Here are a few key features to look for:
Yes! Nutshell lets you track both sales and activity quotas. Set monthly sales targets and weekly activity goals (calls, meetings, demos) for your team. The system automatically tracks progress and displays quota performance in your reports and dashboards, helping you keep everyone on track.
Absolutely. You can download reports as charts or spreadsheets, and share saved reports with teammates inside Nutshell. Shareable reports (available on Pro plans and above) make it easy to distribute insights to stakeholders, even if they don’t use Nutshell. Your data stays accessible wherever you need it.
All plans include basic sales reports. Growth plans ($25/user/month) add activity reports, email reports, and quota tracking. Pro plans($42/user/month) unlock the full reporting suite—including forecast, funnel, losses, custom reports, and shareable reports. Compare features to find your fit.