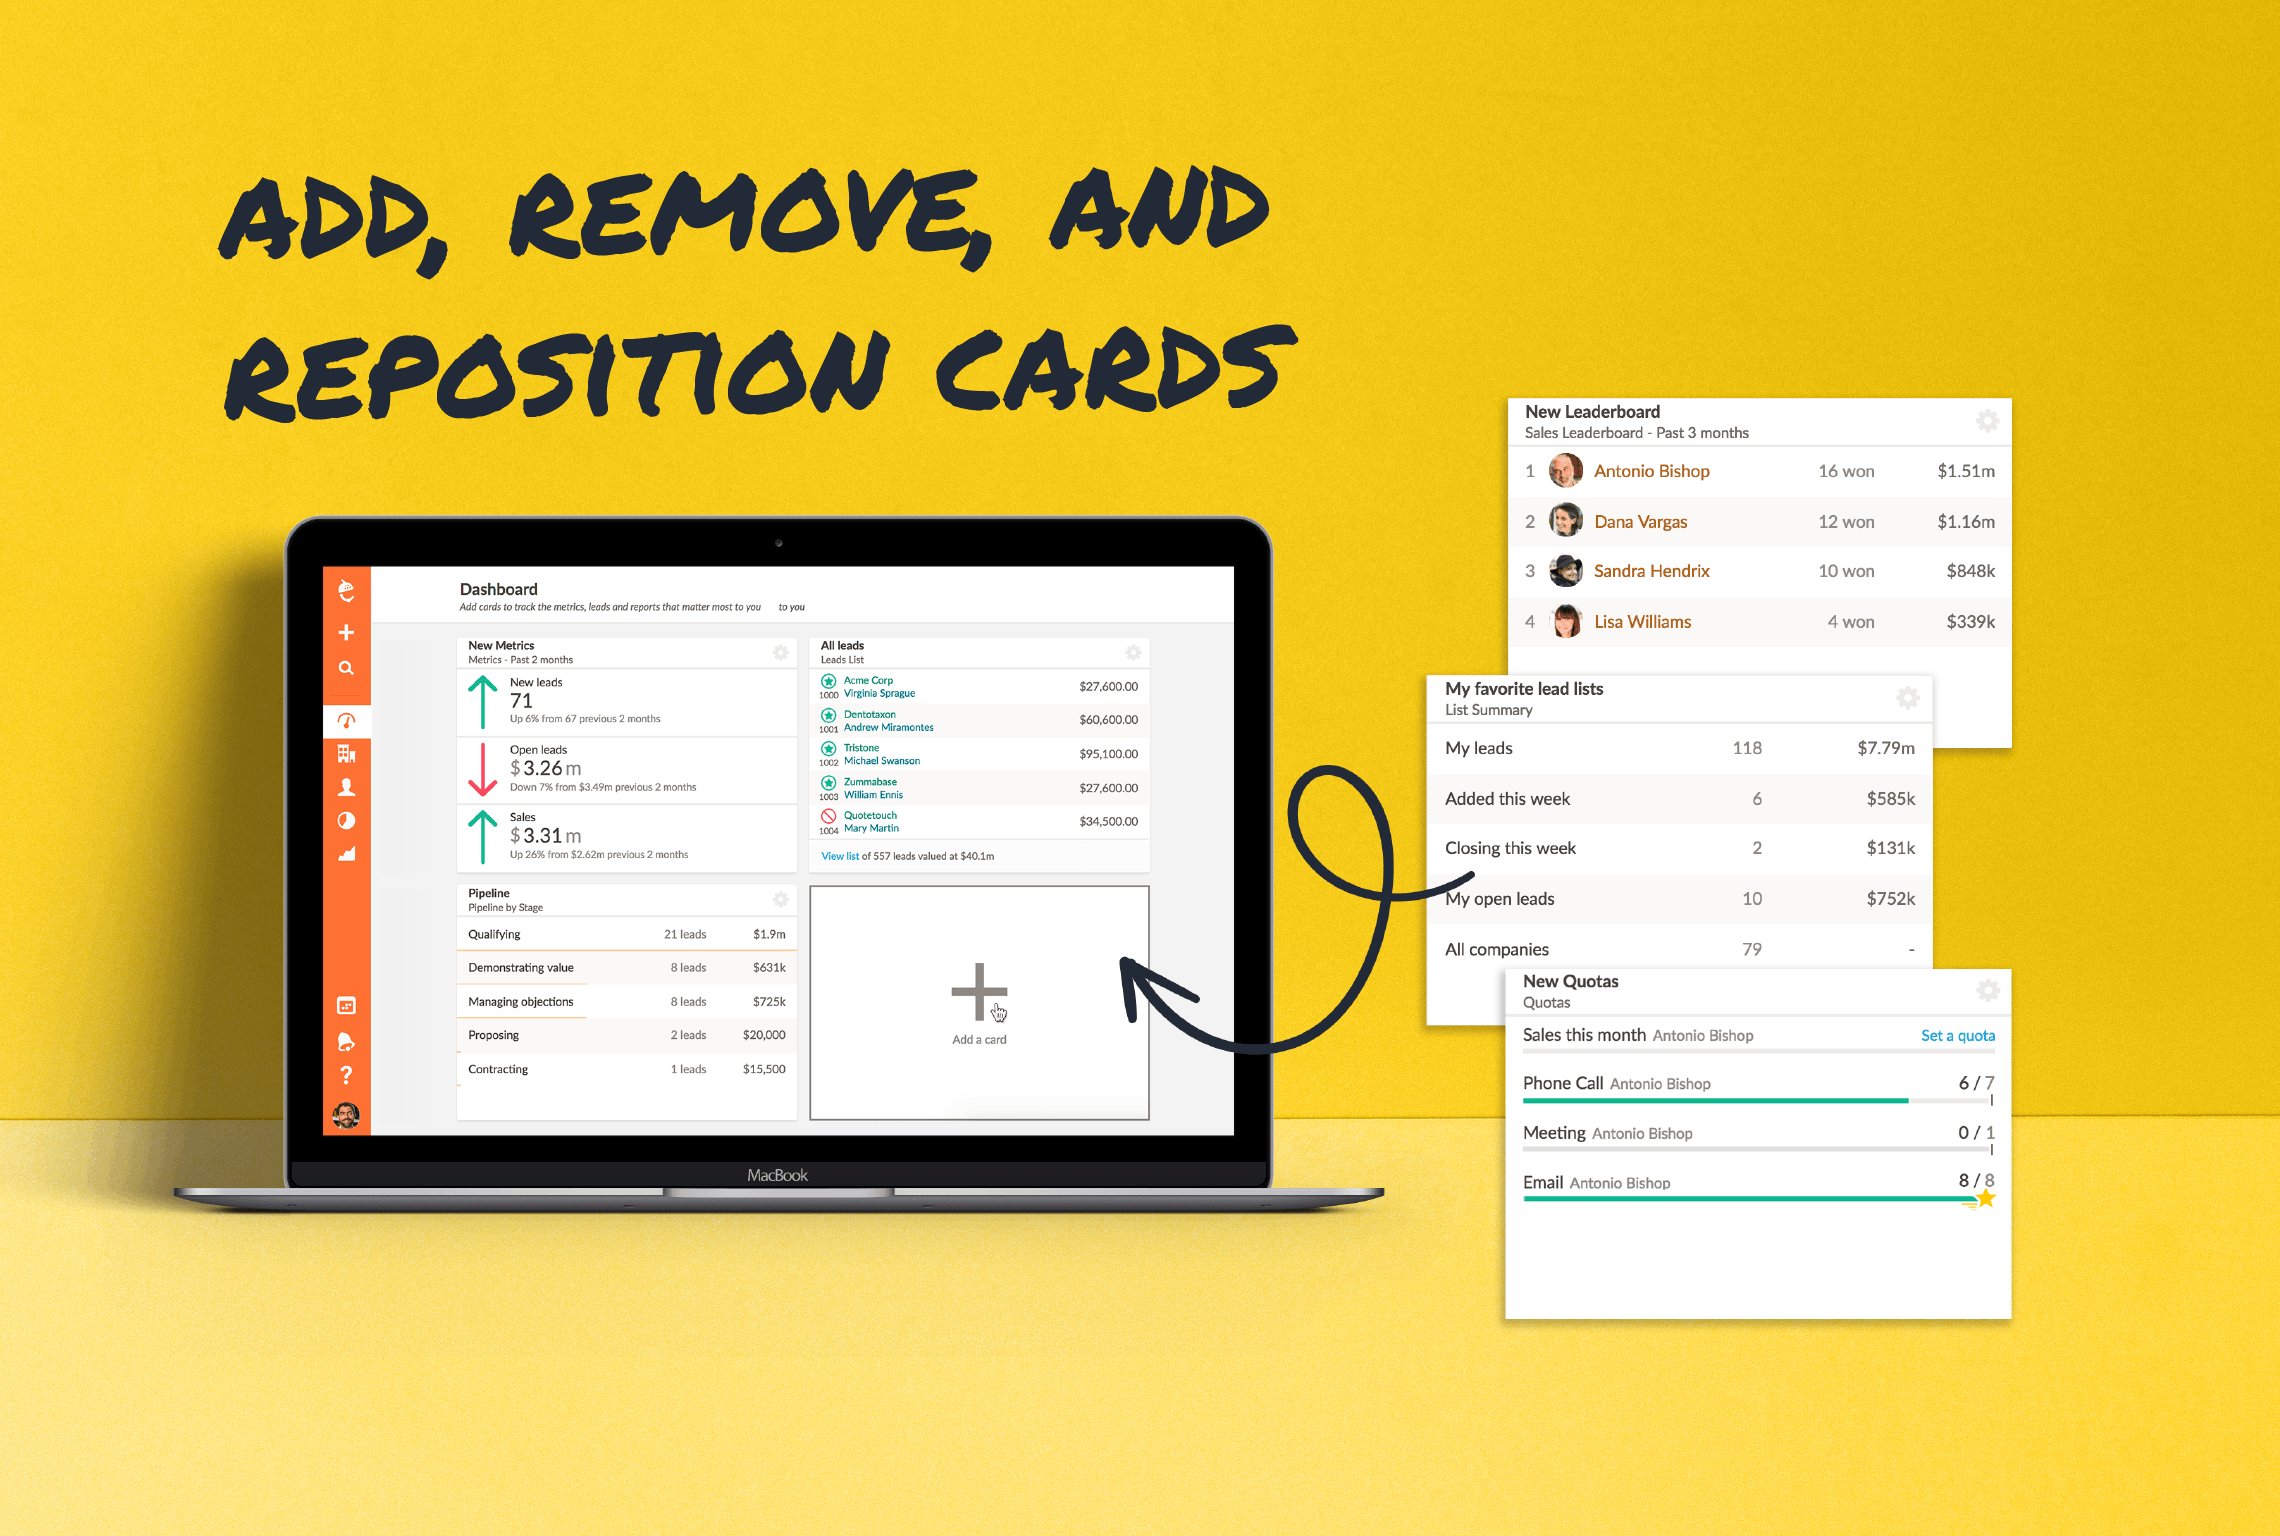
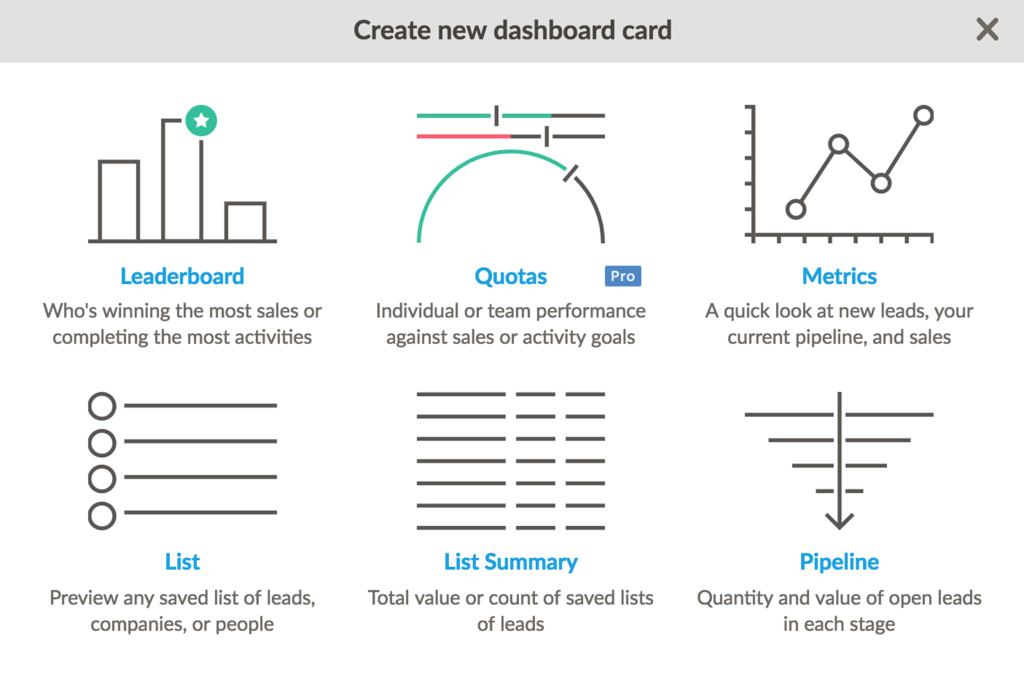
Nutshell—and any CRM worth its salt—collects all kinds of information about prospects and customers. Making the right information available and actionable to each user is the hard part. Solving this problem is a core reason we originally created Nutshell.
That’s why we’re excited to announce the launch of Nutshell’s new sales dashboard, which puts the information that sales managers and reps care about most in one convenient place.
Each user decides what they want to see on their dashboard by adding cards. Cards show everything from weekly activity quotas to the biggest sales of the month. This initial launch includes six types of dashboard cards: Leaderboard, Quotas, Metrics, List, List Summary, and Pipeline.

It’s easy to add, remove, and reposition cards so that the most important data is front and center. Each user’s daily activities, tasks, and company timeline is also displayed on the dashboard.
Click an empty slot on your dashboard, select your card type (Leaderboard, Metrics, List, Pipeline, or Quotas), name it, and configure settings using the gear icon. Drag and drop cards to rearrange them. Each user customizes their own dashboard to focus on what matters most.
Sales reps should focus on Sales Metrics, My Open Leads, Hot Leads, and Sales Quota cards to track personal performance. Sales managers benefit from Leaderboard, Pipeline, Team Quotas, and List Summary cards for full team visibility and performance monitoring.
Yes! Nutshell offers native iOS and Android apps where you can view leads, log activities, and manage contacts on the go. However, the full customizable dashboard experience with all card types is optimized for desktop use through your web browser.
Your Nutshell dashboard displays real-time data. When you or your team updates a lead, logs an activity, or closes a deal, those changes appear immediately on your dashboard. Simply refresh your browser to see the latest information reflected in your cards.
Dashboard cards provide an at-a-glance view of key metrics for daily monitoring, while reports offer deeper analysis with filtering, segmentation, and historical data. Use your dashboard for quick daily check-ins and reports (found under the chart icon) for detailed performance analysis and forecasting.
Join 30,000+ other sales and marketing professionals. Subscribe to our Sell to Win newsletter!