Skip to main content ↓

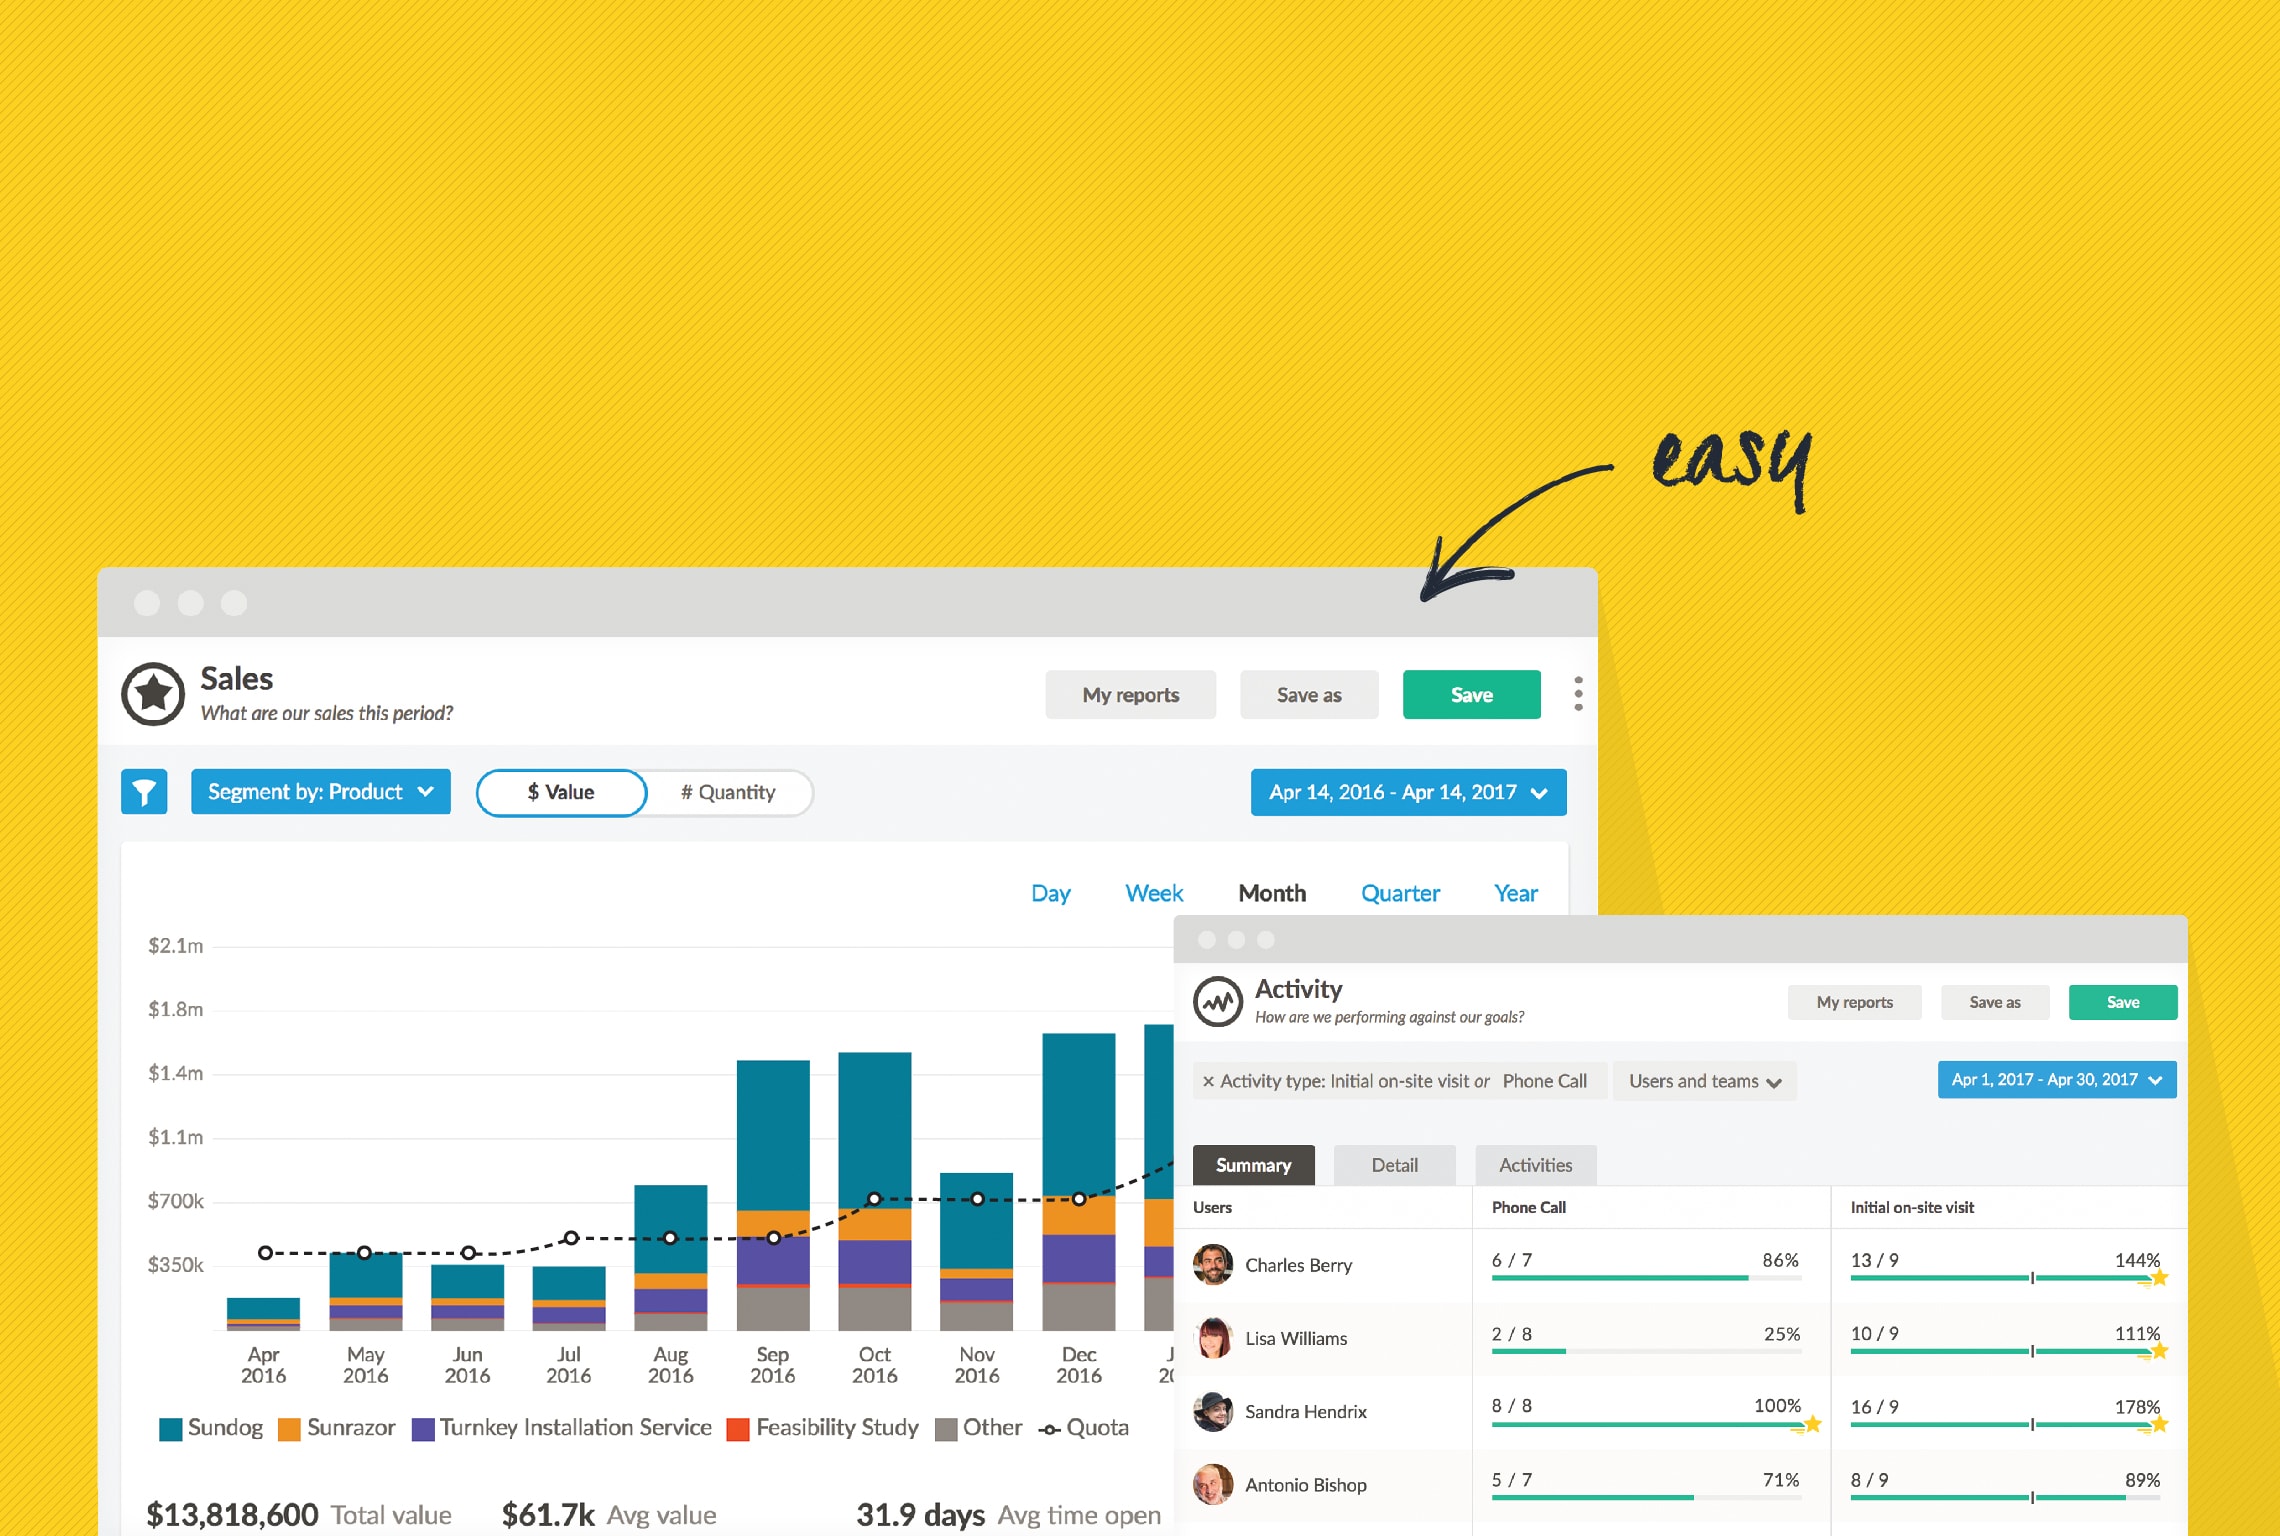
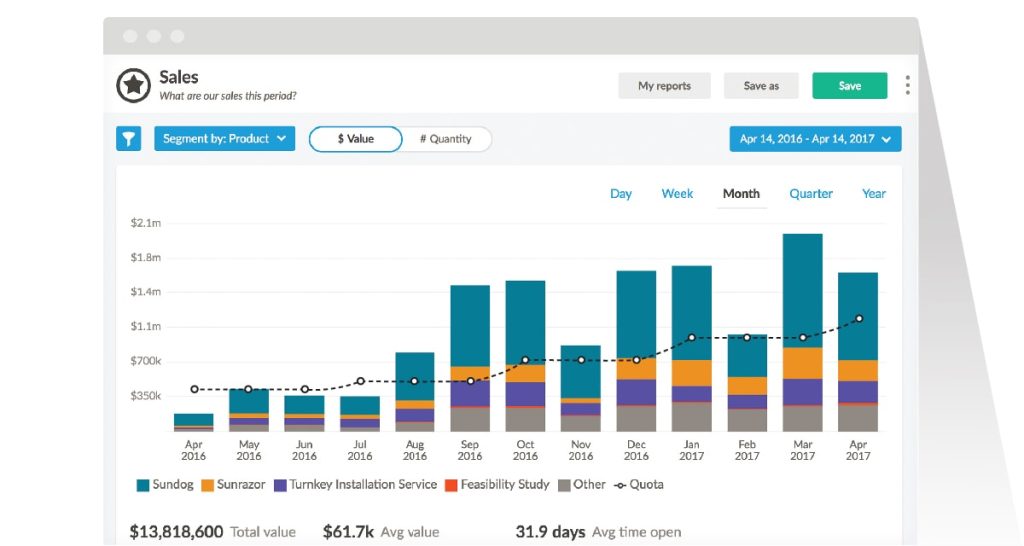
Nutshell Launches All-New Reports to Give Sales Teams Exceptional Insight Into Their Numbers

Written by
Chris Cain VP of Product Development at Nutshell
Chris Cain VP of Product Development, Nutshell
Last updated on: April 24, 2026
a computer screen shows a graph that says easy on it

We’ve just made it even easier to chart your sales team’s performance!

Nutshell has updated our reports and charts to provide at-a-glance insight, so your team can more easily measure performance and pinpoint areas for improvement.

a screenshot with a graph in the Nutshell app showing sales from april 2014 to april 2017

Here are the key benefits and advantages that our new Reports provide to sales teams:

  • Instant access to the information you need most often, including sales, lost deals, and forecast reports
  • An intuitive interface that eliminates the need for an administrator to set up or run reports
  • Daily “Snapshots” of key business health metrics so you can track trends in pipeline growth, win rate, and sales-cycle length over time
  • The ability to save and share reports with your team
  • Presentation-ready charts that can be downloaded with the click of a button for quick and convenient use in any presentation

A huge thank you to all our customers whose feedback helped make these reports as powerful, valuable, and user-friendly as possible. We hope you love them!

NO CREDIT CARD REQUIRED

Not a Nutshell customer? Try us free for 14 days!


GET STARTED

a cartoon of a man holding a yellow balloon
BACK TO TOP

Join 30,000+ other sales and marketing professionals. Subscribe to our Sell to Win newsletter!