Skip to main content ↓

How small businesses can unlock the full power of CRM reporting


Written by
Will Gordon director of Marketing at Nutshell
Will Gordon Sr. Director of Marketing
Last updated on: August 27, 2026
Business professional analyzing a sales dashboard with bar charts and a doughnut chart

Quick answer: How can small businesses unlock the full power of CRM reporting?

Small businesses get the most from CRM reporting by ditching activity metrics and focusing on outcome-driven KPIs like win rate, pipeline coverage, lead response time, and deal velocity. Tie your dashboard to a recurring meeting, make sure every review ends with a clear action, and you’ve got a reporting habit that actually moves the needle.

Many small business sales teams have a wealth of data stored in their sales software. Teams with access to CRM reporting tools can turn that data into useful reports that provide genuine insight and improve decision-making. 

CRM reporting is the use of customer relationship management (CRM) software to monitor, evaluate, and visualize sales activities and outcomes. Advanced systems with a broader toolset also let you generate marketing and engagement reports.

A good sales report could provide anything from a clear overview of where the business’s revenue comes from to individual sales rep performance metrics. The key to an effective report is knowing which data to use and how to structure it.

Nutshell created this guide to help small business sales teams get the most from their CRM reporting tools, including which metrics to track and how to build a reporting dashboard your team will regularly use.

Key takeaways

  • Activity metrics (number of calls logged or emails sent) measure team effort, but tell you nothing about sales revenue.
  • To ensure an effective sales dashboard, limit KPIs to a few meaningful, outcome-driven metrics, including win rate, pipeline coverage, lead response time, and deal velocity.
  • A sales dashboard with metrics discussed at regular team meetings and tied to resultant actions influences real decisions.

Why do many sales dashboards underperform?

The primary reasons for poor sales dashboard performance are usually metric selection and workflow disconnection.

When sales teams select the wrong metrics to track, their dashboards aren’t as useful as they could be. You’ll often find teams defaulting to tracking activity volume metrics, such as the number of calls logged, emails sent, contacts added, etc. They’re easy to capture, and totals always increase, so they make you feel like you’re progressing. 

The real problem with tracking activity metrics is that you’re measuring effort instead of outcomes. Metrics that help you track outcomes can tell you whether or not you’re going to hit your monthly goals.

Reports that don’t align with your workflows may not be included in recurring meetings or considered in decision-making because the data isn’t directly connected. A dashboard populated with misaligned data becomes more of a decoration than a useful tool.

When selecting metrics for your sales reporting dashboard, ask this question as an easy test: If the number drops by 20% tomorrow, will my team react and adjust? If it’s a yes, keep that data where you can see it.

Which KPIs belong on a sales KPI dashboard?

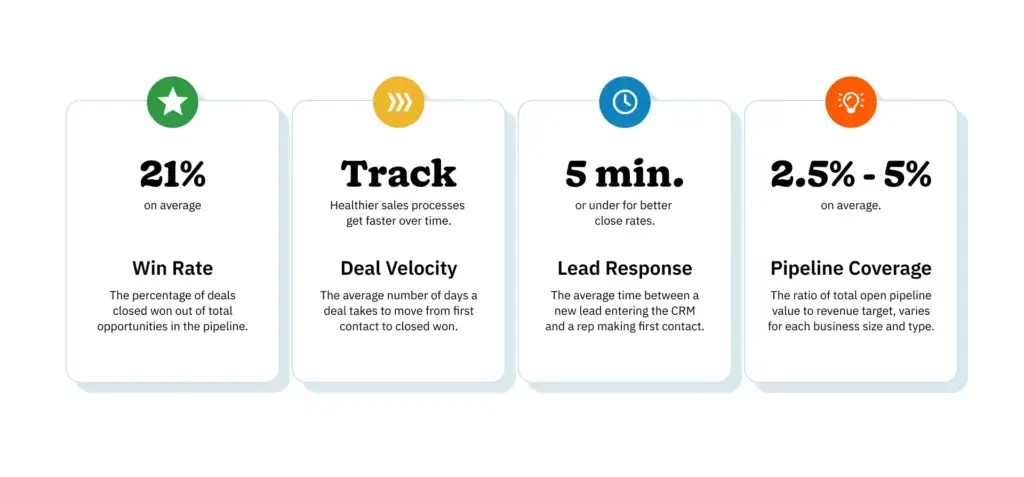
Infographic showing four essential sales KPIs, including win rate, pipeline coverage, lead response time, and deal velocity, with benchmark figures

Four KPIs give sales teams a consistent view of their pipeline health:

  1. Win rate: Your win rate is the percentage of pipeline deals won over a specified period, and it lets you know whether your sales process is effective. On average, B2B sales teams experience a win rate of about 21%, according to research by HubSpot in 2025.
  2. Pipeline coverage: This is the ratio of your open pipeline value to your sales revenue target. It’s a KPI that gives teams a forecast of their pipeline health. Optifai’s 2026 study reveals a reliable minimum gross ratio is around 2.5 to 3 times the target for SMBs, 3 to 4 times for mid-market businesses, and 4 to 5 times the target for enterprise companies.
  3. Lead response time: The time it takes for a rep to make first contact with a lead after it enters the pipeline is your lead response time. It’s a KPI that any team can improve on with the right approach, and keeping your response times low can have a positive impact on your sales conversion rates. Research done by Optifai in 2026 indicates that B2B teams that respond to leads within 5 minutes achieve a 32% close rate on average.
  4. Deal velocity: Deal velocity measures how long it takes to close a deal from the time it enters your pipeline. It helps teams pinpoint pipeline bottlenecks and high-impact areas for improvement. Every business’s deal velocity will be different, but you can still track your own baseline and monitor improvements over time.

How do you build a dashboard that your sales team will use?

Consistent dashboard usage is all about instilling the habit using these three tactics:

  1. Link it to a key question: The dashboards teams refer to most often answer questions they regularly ask and directly affect their core objectives. Examples include “Where are our deals stalling?” and “Are sales on track for the month?” 
  2. Make outcomes lead to action: Reports should be reviewed at a regular cadence, and outcomes should result in teams leaving the review with a list of specific actions.
  3. Tie it to a calendar event: Instead of creating a separate meeting to review reports, incorporate relevant reviews into existing meetings. That way, it’s easier to create the habit, but also allows teams to bring up-to-date KPIs into their discussions and decision-making.

What is AI-driven CRM reporting, and how does it work?

AI-powered reporting is fast becoming a standard across modern CRM platforms and comes in two distinct forms.

Built-in AI reporting

Some modern CRMs can provide detailed reports from your data by prompting the system in plain language. For instance, say you wanted a report illustrating the number and value of sales for each team member over the quarter. In this case, you could simply ask, “Show me sales by rep this quarter,” and receive your answer in chart form in seconds.

Sales teams can also use AI tools in platforms like these to surface specific insights about their data, including anomalies, pipeline gaps, and stalled deals. These capabilities put useful, actionable data in the hands of each rep.

Claude and MCP integration reporting

Another way CRMs allow you to extract insights through AI is via MCP (Model Context Protocol) integration. MCP integration, in this context, is the ability to connect an AI platform, such as Claude, directly to your CRM and use that platform for conversational data lookups, multistep workflow automation, and sales guidance. 

On the reporting side, sales teams can use the MCP integration to quickly surface a broad range of useful data points, like deal queries, cross-object analysis, churn risk, competitive tracking, and more.

The reporting habits that separate growing sales teams from stagnant teams

CRM reporting is at its most effective when you’ve pared the data points down to just the most meaningful KPIs that actually influence core decisions and review them regularly. Four of the most useful metrics for small businesses to track are win rate, pipeline coverage, lead response time, and deal velocity because they give teams optimal pipeline clarity.

AI reporting tools are making it even easier for teams to leverage and understand their data. That said, teams getting the most from their CRM data are those that have created a regular habit around their reporting and ensured that the metrics drive the decisions they make.

Frequently asked questions about CRM reporting

  • 1. What is CRM reporting?

    CRM reporting is the process of collecting, organizing, and visualizing sales data within a CRM platform to help teams track performance, forecast revenue, and identify where deals are won or lost.

  • 2. What is a sales KPI dashboard?

    A sales KPI dashboard is a visual interface inside a CRM that displays key performance indicators in real time. The most effective sales KPI dashboards focus on a small set of revenue-connected metrics, such as win rate, pipeline coverage, lead response time, and deal velocity, rather than activity counts that don’t predict outcomes.

  • 3. What should a sales pipeline report include?

    A sales pipeline report should include the total value of open deals by stage, the average deal velocity, the win rate over a specific period, and any deals that have passed their expected close date. A strong sales pipeline report gives sales managers enough context to prioritize coaching conversations and spot where process improvements will have the most impact.

  • 4. What is the difference between a sales report and a sales dashboard?

    A sales report is a static snapshot of your CRM data for a specific period, like a weekly deal summary or a quarterly win rate analysis. A sales dashboard is a live view of metrics that’s continuously updated and gives teams a read on performance at a glance without generating a new report each time. Sales reports are best for structured reviews and analyzing trends, while a sales KPI dashboard is designed for daily visibility and fast decision-making.

  • 5. How often should small businesses review their CRM reports?

    Sales pipeline reports and activity metrics are best reviewed weekly. Pipelines move fast, and a monthly review cadence could lead to deals falling through the cracks before someone picks them up. Broader metrics like customer lifetime value, lead source attribution, and average deal size can be reviewed at monthly and quarterly reviews. That said, consistency is crucial. A short weekly pipeline review built into your existing team meeting trumps an in-depth report that’s only opened quarterly.

BACK TO TOP
Join 30,000+ other sales and marketing professionals. Subscribe to our Sell to Win newsletter!