How CRM Dashboard Customization Turns Your Pipeline Data Into Decisions

-
Quick answer: How does CRM dashboard customization turn pipeline data into decisions?
CRM dashboard customization turns pipeline data into decisions by surfacing the right metrics, for the right roles, in the right format. Instead of raw data requiring interpretation, a well-customized CRM dashboard delivers immediate clarity, showing sales reps, managers, and executives exactly where to focus and what to act on.
There’s an endless stream of data coming into your CRM. But the true value lies in how your company chooses to utilize that data. The last thing you want is for your team to spend their time deciphering and digging through that data. That’s why a CRM dashboard customized to your business objectives is essential.
The goal of an optimized CRM dashboard is to channel your team’s focus. Customizing a CRM dashboard creates a visual reporting structure within the CRM that shows the right metrics to the right audience in the right configuration. This way, the dashboard evolves from a report into a tool that drives real business decisions.
This Nutshell guide on CRM customization and reporting explores how companies turn their CRM data into a genuine competitive advantage. And the dashboard is where that competitive edge shines.
Key takeaways
- A customized CRM KPI dashboard that serves role-specific needs eliminates the need to hunt for answers.
- Determining the ideal visual format for your data type separates a genuinely useful CRM dashboard from an unnecessarily cluttered one.
- Solid reporting automation is what bridges the gap for confident decisions from real-time data.
Table of contents
What is CRM dashboard customization?
CRM dashboard customization is the tailoring of the reporting module within a CRM to align with the required pipeline views, metrics, and data visualizations needed by teams to meet their respective goals.
Standard dashboards are useful, but they’re built with every user in mind and aren’t optimized for any specific role. A well-customized dashboard is a display that aligns with the key decisions a particular role is concerned with.
For instance, a sales manager’s dashboard and a marketing manager’s dashboard should not be the same. Their roles and objectives are different, which means the metrics that are important to them are different.
Customizing your CRM dashboards is also something you’ll revisit at intervals. It’s an ongoing process because your business objectives change, your team expands, and additional data sources become available, which means the metrics you track change.
Why does your dashboard design determine your decisions?
There is a direct relationship between the visibility of data and the performance of a business. According to research conducted by Forrester in 2026, established analytics programs consistently give businesses between two and five times ROI related to revenue growth, reduced risk, and cost efficiency.
Those returns are directly influenced by visible and relevant data, easily accessible by the person who needs to see it.
The most successful teams see dashboard customization as part of their overall strategy. These teams determine exactly which decisions their dashboards should inform, and design their dashboard visualizations based on those.
An effective CRM dashboard keeps up with the natural flow of your business. It represents how your business really runs, integrates the most important KPIs, and shifts as your business priorities change.
Which KPIs belong on a CRM dashboard?
KPIs included in an effective CRM dashboard should relate directly to the decisions and actions teams take in their daily work.
The best dashboards include a mix of leading and lagging KPIs. Lagging KPIs show past results, and leading KPIs predict future outcomes. An example of a lagging KPI is the win rate, while a leading KPI example is the number of weekly demos scheduled. Both types of KPIs are necessary to gain a full understanding of performance.
The role of the user is vital here. A single dashboard serving teams across all departments ultimately serves no one well.
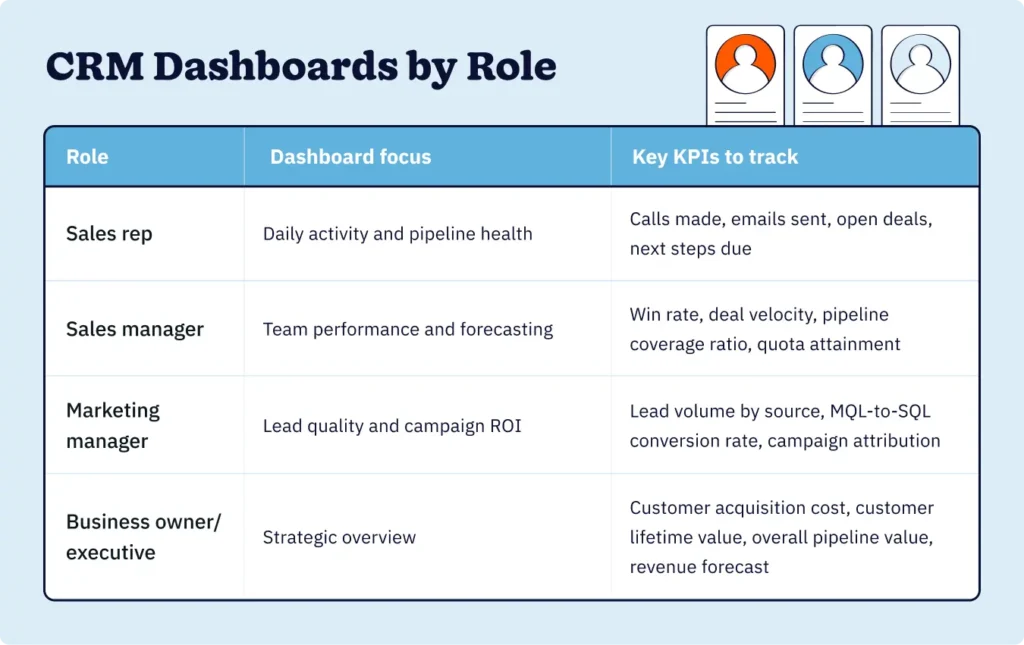
Here’s a practical starting framework to build an ideal role-focused CRM dashboard:

Bear in mind that your CRM dashboard is not meant to function as a scoreboard. See it as more of a navigational tool, intended to show users the opportunities and risks related to their work in order to prompt them to take action.
One useful rule to follow is to limit dashboard views to between seven and ten KPIs. Displaying more KPIs than this typically leads to information overload and less insight.
What types of data visualization work best in CRM reporting?
CRM data visualization involves translating customer and pipeline data into visual formats, like charts and graphs, to help users identify data trends and patterns quickly.
The most effective visualization format depends on the type of data being displayed. Selecting an unsuitable format for the data creates friction. Even the highest-quality data will be hard to read if a mismatched visual format is chosen.
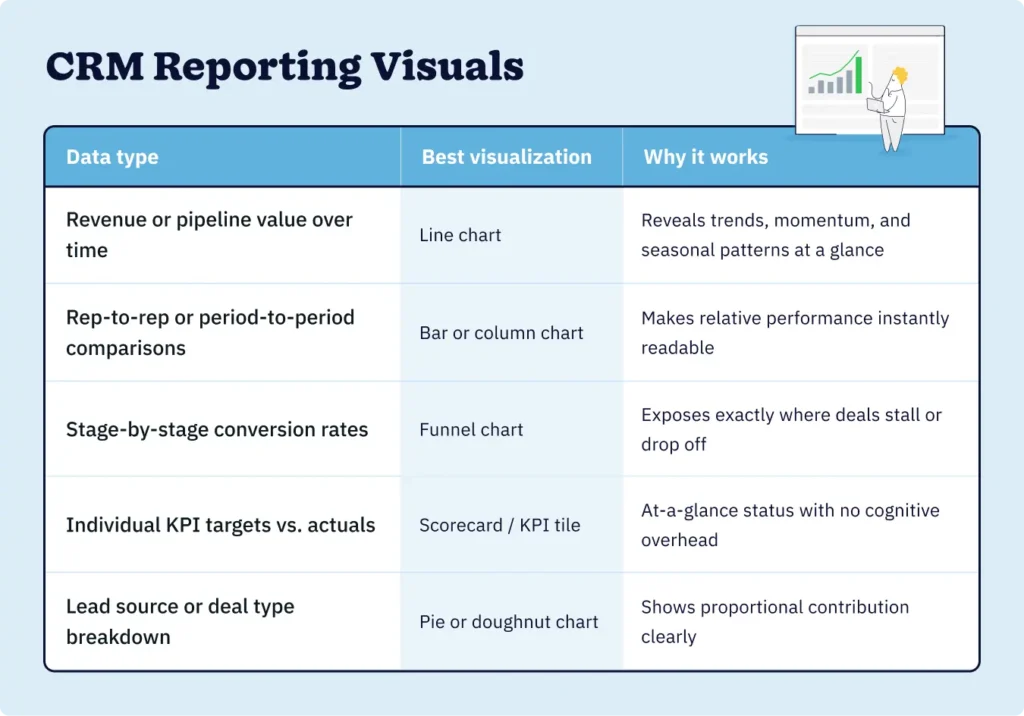
The following table offers some guidance on how to best match your data with a suitable visualization format for an effective custom CRM dashboard:

Modern CRM platforms have built-in reporting tools and visualization capabilities. Teams requiring greater functionality can typically integrate more specialized reporting tools that offer a broader spectrum of visualizations.
A well-known dashboard design test is the five-second test. This gauges how quickly and easily a person viewing the CRM dashboard can find and interpret the insight. If this takes longer than five seconds, then the visualization is too complex and needs to be simplified.
How does reporting automation sharpen decision-making?
Reporting automation refers to the setting of rules and scheduling to automate the delivery of CRM data to the individuals most impacted by those insights, without the need for them to create or run a report.
The value of CRM data is its timeliness. For example, an alert indicating the status of a deal three days after it stalled is far less useful than an alert that comes through as soon as the lead goes silent. Automation ensures that the gap is closed.
Examples of automation in reporting for CRM systems include:
- Scheduled pipeline digests: Summaries are sent to sales managers or executives on a daily or weekly basis.
- Threshold alerts: Notifications set to a specific threshold to alert managers of a transaction that has stalled, decreased in value, or moved backward in a transaction pipeline.
- Role-based report distribution: Automated role-specific reports providing each report recipient with only the information relevant to their role.
- Forecast roll-ups: Automated consolidation of individual pipeline contributions to team and organizational forecast levels.
Forrester’s research confirms that organizations that connect their analytics to their strategic KPIs outperform organizations that rely on manual reporting cycles.
How to build a CRM dashboard that teams actually use
An effective CRM dashboard is designed to direct users to the actions that need to be taken. It’s important to remember that sophistication in its design isn’t what drives dashboard adoption. What makes the difference is knowing what decisions users need to make and building the dashboard to address those decisions.
A practical four-step framework
- Start with the question, not the metric: Ask what decisions need to be made and what data is required to support those decisions. Build your dashboard visualization around the metrics that directly support those decisions.
- Design for roles, not departments: Although sales operations, sales reps, and sales managers are in the same department, they’re each accountable for different decisions. Custom role-specific CRM dashboard views allow them to remove the clutter and only see what’s relevant.
- Apply the 7 to 10 metric limit: Including only the most important metrics allows the dashboard to maintain focus and clarity. Anything beyond the necessary KPIs becomes noise.
- Build in a quarterly review cadence: Shifting business priorities can make a dashboard obsolete for the goals that it was designed to address from one quarter to the next. A quick quarterly dashboard review can realign the strategy and reporting environment to current business priorities.
The best customizable CRM platforms offer the flexibility to optimize dashboards as needed without the need for a developer. Users who succeed are the ones who consider the dashboard a living tool that requires updating as their priorities change.
The dashboard is where CRM data becomes a decision
CRM dashboard customization isn’t reserved for enterprise teams with dedicated analytics staff. It can be done by any company, and the benefits can be seen in sales, marketing, and leadership decisions thereafter.
Companies that benefit the most from their CRM data don’t necessarily have the most data. They’re the companies that decided what’s important, built their dashboard around that, and used those data insights to decide their next steps.
Ensure the right metrics are matched to the right roles, present them clearly, and get them delivered automatically so that the insights come through when needed. That’s the discipline that will take a CRM from sitting in the background to actively driving company and revenue growth.
FAQs
-
1. What is the difference between a CRM report and a CRM dashboard?
A CRM report is a static or generated output of data for a specific time period or query. A CRM dashboard is a live, visual interface that displays multiple metrics simultaneously and updates in real time. Dashboards are built for ongoing monitoring. Reports are built for deeper, point-in-time analysis. Both have a role. They just serve different moments in the decision-making process.
-
2. How many KPIs should a CRM dashboard display?
Most dashboard design frameworks recommend 7 to 10 metrics per view. Fewer metrics means each one gets more attention, and more useful attention. Teams that start with fewer, high-impact KPIs consistently find it easier to act on their dashboards than teams that try to surface everything at once.
-
3. Can small businesses benefit from CRM dashboard customization?
Yes. Often more immediately than larger organizations. Small businesses typically have less tolerance for wasted time and misdirected effort, which makes having the right metrics visible at a glance especially valuable. Many CRM platforms designed for small and midsize businesses, including Nutshell, offer dashboard customization without requiring technical expertise to set up or maintain.
-
4. What CRM platforms offer the most dashboard customization?
Platforms vary significantly in their customization depth. Salesforce and HubSpot offer extensive customization but come with steeper learning curves and higher price points. Nutshell, Pipedrive, and Close CRM offer strong dashboard customization with lower complexity, making them well-suited to small and midsize teams. The right choice depends on the team’s technical resources and how deeply they need to customize their reporting environment.
-
5. How often should a CRM dashboard be updated or reviewed?
A quarterly review cadence works well for most teams. This allows enough time to assess whether current metrics are driving useful decisions, while catching misalignments before they compound. Dashboards tied to specific campaigns or initiatives should be reviewed at the close of each campaign cycle.
BACK TO TOPWritten by
Will Gordon Sr. Director of MarketingEdited by
Sam Poole Associate Content MarketerReady to try
Nutshell for Free?Thank you! Your submission has been received!Oops! Something went wrong while submitting the form.
Best CRM For Gmail: Top Solutions For Google Workspace Teams In 2026
Published on: February 18, 2026Sales Performance Reviews: 9 Tips to Make Them Valuable
Published on: November 10, 2022Highly Effective Strategies for Elevating Sales Team Performance
Published on: November 10, 2022Join 30,000+ other sales and marketing professionals. Subscribe to our Sell to Win newsletter!
- Product
- Nutshell Overview
CRM & Sales
Our powerful and easy-to-use flagship product.Marketing
Email marketing, forms, landing pages, and more.Engagement
Webchat, SMS, WhatsApp & more in your Omni-Channel Inbox.Prospecting
Prospect for new leads and new contacts in your CRM.Proposals & Invoices
Create & send quotes, invoices and contracts in your CRM.
AI
See why Nutshell is the leading AI CRM.Integrations
Connect to Google/Microsoft and over 5,000 Apps.
ReportingCreate reports and forecasts in an instant.Mobile App
Take your CRM with you wherever you go.CRM Advisor
Get a dedicated point of contact to get the most out of Nutshell.
- Pricing
Nutshell AI
- Resources
- Contact Us
Contact Sales
Send us your questions or book a 1-on-1 demo.Join a Demo
Join a group demo for a general overview of Nutshell.
Contact Support
Contact our support team via live chat in app or via email.Become a Partner
Refer businesses to Nutshell & earn commissions.
Contact Marketing
Questions about our website or our marketing opportunities?Careers
Join our growing team! See current openings.