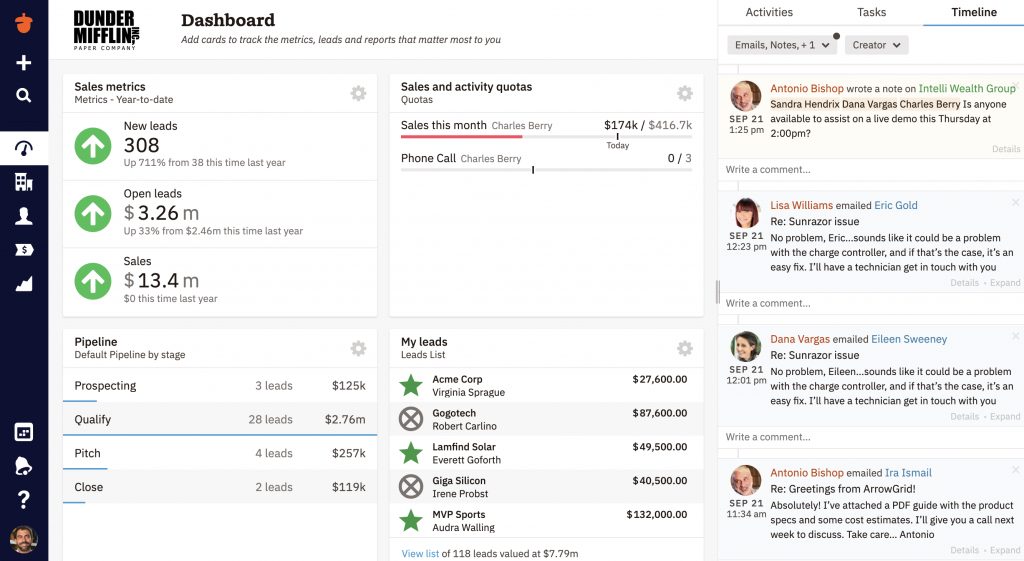
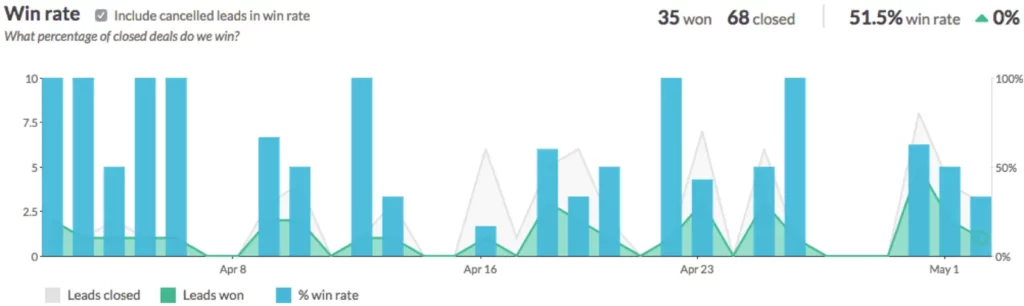
Running a sales team is a lot of work. You want a constant flow of leads and prospects through your sales pipeline, but it can be a lot to manage, especially if you don’t know how well you’re performing. That’s why it’s good to have a customer relationship management (CRM) tool.
A CRM lets you gather your customer data into a central location, categorize it, and analyze it to learn more about your audience. You can then use the insights you gain to improve your marketing and sales campaigns.
But even a CRM can be a lot to deal with if you’re just trying to keep up with the most important info without wading through all the other data stored there. That’s why most CRMs come equipped with CRM dashboards.
What is a CRM dashboard, though? Keep reading to find out!
A CRM dashboard is a component of many CRM systems that presents the most important CRM info on one screen for your convenience. Think of it as a snapshot of your sales pipeline—your recent sales, valuable sales metrics, and more.
CRM dashboards usually consist of around 5–7 cards or blocks, which show images and graphs rather than detailed chunks of text. Some CRMs might already have a premade dashboard, while others let you build your own the way you want it.
So, why might you want to build a CRM dashboard? The answer comes down primarily to convenience. Having a dashboard makes it incredibly easy for you to get large-scale sales info at a glance rather than having to dig through multiple forms and charts in your CRM.
With info on recent sales activity readily available, your team can work much faster. They’ll save time they would otherwise spend searching for data, and having the information right there in front of them helps keep them on track and accountable.
It’s also worth noting that CRM dashboards usually update in real-time, ensuring that all the information you see there is perfectly up-to-date.
Not all CRM dashboards include the same components. There are usually many customization options, where you get to choose what your dashboard shows. That said, there are a few things every good dashboard will need to elevate your CRM dashboard UI. Here are three of those things.
When building a CRM dashboard, one of the first things to include is your most recent leads and sales. Having that data on your dashboard helps you see how productive you’ve been in the short term and also works as a source of motivation by showing off what you’ve achieved. Plus, it lets you identify which new leads need attention from the sales team.
Another item to include on your dashboard is the most recent team activities, including things like phone calls and emails. This lets you keep an eye on what your team is doing and how they’re doing it.
Maybe you notice that certain strategies produce outstanding results, or perhaps you see flaws in the team’s overall approach. Whatever it is, you can then respond accordingly.
A good overall view of your sales pipeline on your CRM dashboard helps you quickly identify potential deals within each pipeline stage. You’ll be able to determine the prospective value allotted to each stage and pinpoint deals that need urgent attention.
The ideal CRM dashboard UI needs a space dedicated to important tasks and deadlines. Typically, this section also includes a tab with a calendar view showing your upcoming appointments.
These tasks could include those you’ve input yourself or others created by your CRM’s automation feature. You should be able to access detailed information for each task with a single click from your CRM dashboard and mark them as complete when done.
Every sales CRM dashboard should have a handful of key performance indicators (KPIs), which are useful metrics that give you insight into how effective your sales efforts are. There are plenty of different metrics you can include, and it’s up to you which ones you choose.
Either way, showing those metrics on your dashboard gives you a quick look at the overall performance of your sales.
Attend a live guided tour!
There are countless sales metrics out there, so which ones should make the cut for your custom CRM dashboard design? Well, that’s entirely up to you. You could follow an existing CRM dashboard template or select the KPIs you want to see as part of your dashboard UI.
Here are a few sales metrics you should include.
One of the most obvious metrics to include is return on investment (ROI). ROI shows you how much money you’re earning from your sales compared to how much you’re spending on your sales efforts. It’s a great way to measure the efficiency of your marketing.
Cost per acquisition (CPA) measures how much money you spend on each sale you drive. Needless to say, you want your CPA to be as low as possible. If it’s exceptionally high, you should find a way of revising your sales efforts to be more effective.
Net promoter score (NPS) measures how satisfied customers are with your business. You typically find this metric by having customers answer a survey question where they rate their satisfaction from 1 to 10. The survey data is imported into your CRM and then displayed on your dashboard.
Customer lifetime value (CLV) refers to how much revenue you can expect to make from a given customer as long as they continue to buy from you. This is great for any company that maintains long-term clients rather than relying on single-time purchases.
For the purposes of your dashboard, you can automate your CRM to calculate the average CLV across all your existing customers. Including your average CLV in your dashboard KPIs allows you to see how much value you’re getting from your sales. A higher average CLV indicates a more effective sales process.
It’s worth tracking the average sales pipeline duration on your CRM dashboard. Average sales pipeline duration is simply the average time your customers spend in the sales pipeline before converting. If your average pipeline duration is too high, that indicates you should work to streamline it and speed up the process.
Keeping an eye on your customer churn rate shows you the percentage of customers lost, including the number of customers and the related lost revenue.
Having an overview of this metric and being able to drill down for more information straight from your CRM dashboard helps you determine why you lost the business. Then, you can use this information to set benchmarks and take action before you lose customers.
Your customer retention rate offers a percentage metric that helps you determine reference points to monitor your retention numbers. This metric is key to enhancing how you analyze customer relationships and retain customers.
Retaining existing customers is more cost-effective than acquiring new ones, so this is a critical metric to keep tabs on. With this CRM dashboard KPI visible, you can spot retention trends and discover opportunities to earn customer loyalty.
Set yourself a benchmark and use your customer retention rate metric to monitor your success.
Another prime metric to track is your lead conversion rate, which tells you how many of your leads move from one stage of your pipeline to the next. With it, you can calculate the average percentage of leads that move from prospect to qualified lead or from a booked demo to a proposal.
You can use these figures to analyze and set some conversion benchmarks for your team, and it’s a great way to weed out sales process kinks. Monitoring this metric will help you pinpoint where most of your leads drop out of the pipeline so you know which stage strategies need revising.
Ultimately, you’ll want to know how many prospects become paying customers. Having your win rate visible on your sales CRM dashboard gives you a bird’s-eye view of the percentage of converting leads.
When keeping an eye on this metric, you can record the win rate over a period, then determine an average and set team targets around it. You can also use it to troubleshoot and improve ineffective processes when you see dips in the win rate.
Are you still trying to find the right CRM for your company? Nutshell is the answer. On top of excellent sales automation and analytics features, Nutshell provides a top-tier CRM dashboard that you can customize to your heart’s content with different cards and KPIs.
Of course, you might be hesitant about jumping right into Nutshell, and that makes total sense. That’s why we provide a 14-day free trial. Check it out today to see what Nutshell can do for your business!
Give our powerful, easy-to-use CRM a try for free for 14 days! Or join a live demo to see Nutshell at work!
Join 30,000+ other sales and marketing professionals. Subscribe to our Sell to Win newsletter!
Use our calculator to add up your total investment of CRM and Add-ons
VIEW ALL PRICING