Vanity Metrics: Definition, Examples by Channel, and What to Track Instead
-
Last updated on: April 23, 2026

Key takeaway: What are vanity metrics?
Vanity metrics are metrics that look good on paper, such as pageviews or follower counts, but don’t correlate with real business outcomes like revenue, customer acquisition, or retention.
In sales and marketing, there are so many ways to pretend you’re doing well.
All you have to do is find a couple of metrics that are increasing for your business—any metrics at all, really—and tell your boss, “The numbers are up!”
But here’s the reality check: In a B2B sales organization, anything you measure that doesn’t directly relate to customer acquisition, customer retention, or revenue is essentially a vanity metric. And vanity metrics are only there to make you look good—they don’t tell you what’s actually working.
The problem gets worse when teams spend their time tracking the wrong metrics. When your sales reps are focused on logging activity instead of closing deals, or your marketing team is celebrating web traffic that doesn’t convert, you’re not just wasting time. You’re building a culture that rewards the wrong behaviors. You’re losing visibility into what actually moves the needle. And you’re leaving money on the table.
The good news? Identifying and fixing this problem is simpler than you think. This guide walks you through what vanity metrics are, shows you real examples, and—most importantly—tells you what to measure instead.
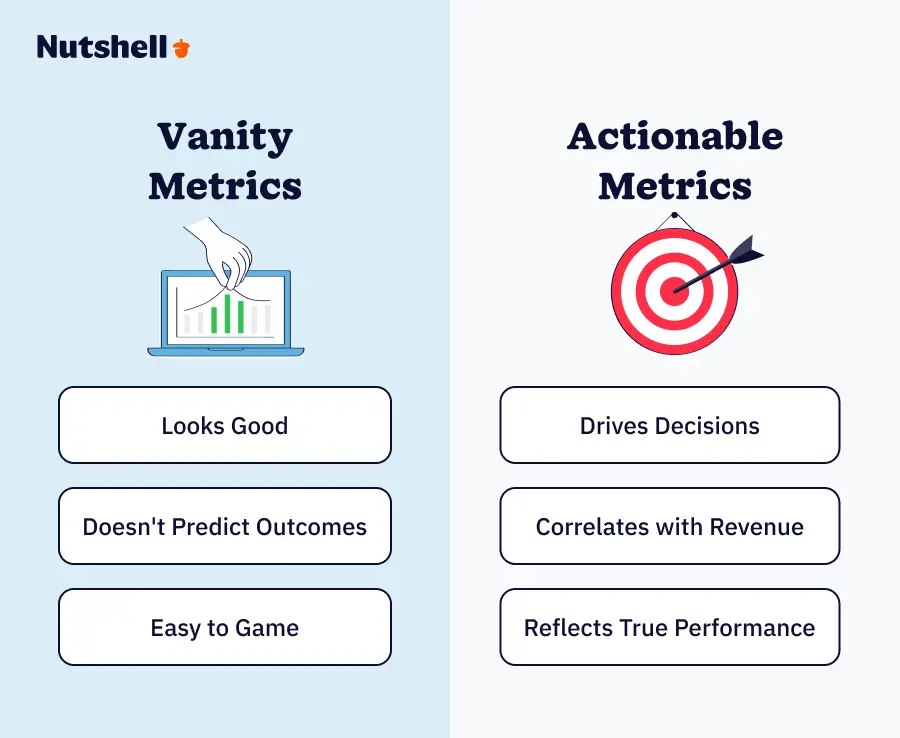
Table of Contents
What are vanity metrics?
Vanity metrics are numbers that may look impressive but often fail to reflect meaningful business outcomes. While they might initially catch the eye, metrics like social media followers or video views often lack relevance to the core health of a website or business.
Instead, critical indicators like active users, engagement rates, and customer acquisition costs offer more profound insights into how a product or initiative aligns with overarching business objectives. Often, vanity metrics reflect your team’s effort, but they have virtually no connection to the impact of your team or the overall health of your business.
Now that we’ve covered the definition of vanity metrics, let’s take a look at some vanity KPI examples and alternative, actionable metrics you should track instead.
By the numbers: Why vanity metrics are a real problem
Before we dive into what they are, here’s what’s actually happening out there:
- 84% of sales reps missed their quota in 2024 – up from 72% in 2023
- 59% of customers aren’t satisfied with their sales teams, yet many of those teams are tracking the wrong metrics.
- 54% of sales professionals say customer expectations are harder to meet now than last year.
The disconnect? Teams are often measuring activity, not outcomes. They’re tracking what feels good on a report, not what actually drives revenue.
That’s where vanity metrics come in. And that’s exactly what this guide will help you avoid.
Summarize with AI:
How to identify vanity metrics
Identifying vanity metrics requires a critical eye toward their alignment with business goals. Consider the following questions:
- Can they drive business decisions? Quality metrics provide actionable insights for strategy development, whereas vanity metrics offer little guidance.
- Can you repeat the results? Vanity metrics often stem from one-time events, while quality metrics offer consistent, reproducible outcomes.
- Do they show the whole picture? Evaluating metrics in context, such as comparing year-over-year data rather than month-to-month, reveals the actual trajectory of performance.
- Is the measurement overly simplistic? Avoid metrics that oversimplify complex aspects of your business. Instead, focus on indicators that provide nuanced insights and paint a clearer picture of performance.
- Does it drive meaningful improvement? Choose metrics that not only track progress but also drive actionable improvements. Metrics should inform strategic decisions and contribute to the continuous enhancement of your product or business processes.
By prioritizing metrics that offer comprehensive insights and actionable data, businesses can make informed decisions to drive success.
DOWNLOAD
Ready to become a better sales leader?
Get 70+ expert strategies for sales management success in our Sales Manager’s Survival Guide.
Why 2025 changes everything: The shift to actionable metrics
If you think tracking vanity metrics is just “not ideal,” 2025 is forcing a reckoning.
The market has shifted. Here’s what’s happening right now:
AI and predictive analytics are replacing backward-looking metrics. Teams are moving from “Here’s what happened last month” to “Here’s what will happen next quarter, and here’s what to do about it.” Generative AI and machine learning now help organizations go beyond basic data analysis into predictive and prescriptive insights. This means vanity metrics—which are purely retrospective—are becoming less valuable by the day.
Marketing measurement is getting more sophisticated, faster. Seven out of eight marketers are investing more in advanced measurement methodologies like Marketing Mix Modeling (MMM) over the next 12 months. That’s not a trend—that’s an industry-wide reset. Simple metrics like “total impressions” or “lead volume” are being replaced by integrated attribution models that show which channels actually drive revenue.
Automation is making it harder to hide. Analytics automation is shifting from “nice-to-have” to essential infrastructure. Teams can now automatically detect anomalies, identify metric deviations in real time, and alert managers when something’s off. You can’t hide behind vanity metrics when your tools are automatically flagging what actually matters.
First-party data is winning. Fifty-eight percent of companies have been over-relying on third-party data. In 2025, that’s changing fast. Teams are prioritizing first-party customer data because it’s reliable and actionable. Vanity metrics often depend on unreliable third-party signals (social media followers purchased from vendors, platform-reported impressions that include bots, etc.). That’s not going to cut it anymore.
If you’re still tracking vanity metrics, you’re not just behind—you’re swimming upstream against industry momentum. The teams winning in 2025 have already made the shift to actionable measurement.
The smart metrics framework: How to evaluate any metric
Before we walk through the 8 most common vanity metrics, here’s a framework you can apply to any metric you’re considering tracking.
Ask yourself these five questions:
- Can it drive business decisions? Quality metrics provide actionable insights for strategy development. Vanity metrics offer little guidance.
- Can you repeat the results intentionally? Vanity metrics often stem from one-time events. Quality metrics offer consistent, reproducible outcomes.
- Does it show the whole picture? Evaluate metrics in context. Compare year-over-year data rather than month-to-month to reveal the actual trajectory.
- Is the measurement overly simplistic? Avoid metrics that oversimplify complex business aspects. Focus on indicators that provide nuanced insights.
- Does it drive meaningful improvement? Choose metrics that track progress and inform strategic decisions. Metrics should contribute to continuous enhancement, not just reporting.
If you answer “no” to any of these questions, it’s likely a vanity metric. Flag it for review. Replace it with something that passes all five tests.
8 sales and marketing vanity metrics to avoid
To help keep you reporting on the right things, here are eight metrics that you should stop wasting your time on and the metrics you should start measuring instead with a bit of help from your CRM reports.
Sales vanity metrics examples
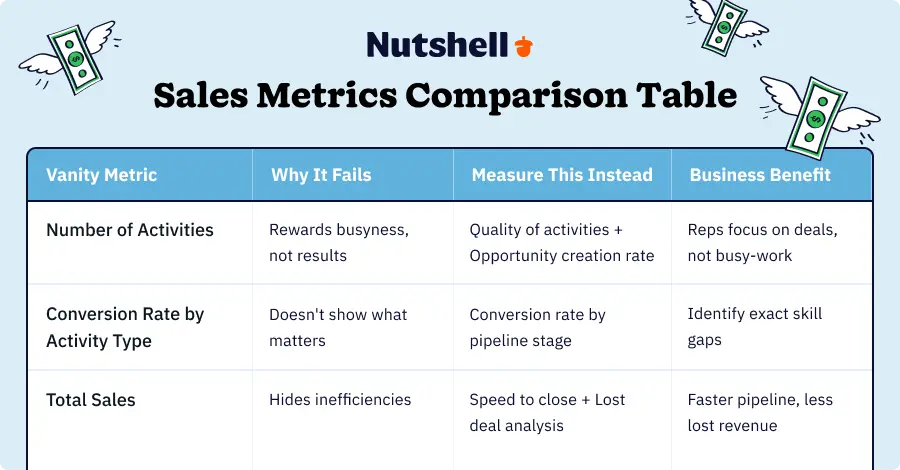
1. Number of activities
One of the most common mistakes that sales teams make is focusing on the quantity of their interactions rather than the quality. An activity report is helpful for understanding your team’s baseline volume of interactions, but without comparing it to other information like your sales numbers or the timelines of leads that should have been won, it’s just a measure of busyness.“
The research backs this up: Sales reps spend only 30% of their time selling during an average week. That means 70% of their time is spent on other work. If you’re measuring all activities equally, you’re rewarding the reps who log the most stuff—not the reps who close the most deals. And if your best rep closes 10 deals from 100 activities, while your busiest rep logs 200 activities but only closes 3 deals, your activity metrics say the second rep is twice as productive. They’re not.
Colleen Francis, president and owner of Engage Selling Solutions, puts it perfectly: “Activity metrics are only relevant when compared with opportunity creation. Measuring activities in isolation tends to make the seller with the most activities look the best, hardest working, and most successful, when this might not be the case. The best reps are the ones who do the least amount of activities to produce the highest number of opportunities.”
Measure this instead: Quality of activities + Opportunity creation rate
Compare the activities logged by your best and worst-performing sales reps, and look for differences you can use to coach the reps who need help. Are they taking good notes? Are they spending time on the kinds of activities that lead to closed deals? Are they making tons of calls or having lots of meetings but not closing?
If not, you need to know what is actually happening during those calls and meetings. In your CRM, check out the timelines of some of their best won leads to see what they’re doing that’s bringing them real success. Nutshell’s activity leaderboard and sales leaderboard can help you spot these patterns—showing you not just who’s active, but whose activity is actually generating opportunities.
The bottom line: If someone asks, “How active was our team this week?” your answer should never be the headline. The headline should be: “Our team generated 23 qualified opportunities this week, which is on pace to hit our quarterly revenue target.”
2. Conversion rate by activity type
Another thing we frequently see among Nutshell’s own customers is sales teams trying to measure conversion rates from one activity type to another. For example, they’ll track how many phone calls “converted” to in-person meetings. While that metric could be useful when testing changes to your phone script, it’s generally irrelevant for two reasons:
- The goal of sales is to close deals, not book meetings.
- Call-to-meeting rate is often more influenced by lead quality than the skill of your sellers (i.e., low-quality leads mean less-qualified prospects, who are more likely to be disqualified during phone calls).
Measure this instead: Conversion rate by stage
By using your CRM’s funnel report, you can identify which stage(s) your team is losing the most deals in, and make targeted improvements. “When a sales rep can’t close deals, it’s rarely a case of not being able to ‘close,’” Francis explains. “Usually, there is a problem in the qualification or presentation stage of the pipeline. By knowing which stages they are below and above average in, you can zero in on the exact skills they need to improve, thereby increasing their performance.”
“Conversion rates also drive lead generation requirements, which in turn drive marketing execution,” Francis adds. “If you don’t know how many leads you need to create the right number of opportunities and closes and by when, your funnel will never be accurate.”
3. Total sales
Whether you’re looking at revenue totals or the number of closed deals, growing sales can make sales organizations feel warm and fuzzy, while masking potential inefficiencies. Obviously, sales totals are important to the health of your business, but they don’t tell you how many deals were lost along the way or why those deals were lost.
Measure these instead: Speed of qualified leads to close and lost lead outcomes
To get a full picture of your sales team’s effectiveness, you need to keep your eye on two things:
- Speed of qualified leads to close. “Conversion speed is critical because once you know how quickly an opportunity moves through the pipeline, you can make time-management decisions about moving opportunities out of the pipeline that are delayed to the point of lost,” Francis says. “Most sellers hang on to lost deals for double the amount of time it takes them to win a deal. If you are measuring the time each deal is in the pipeline, you can cut ties with these time-wasting lost deals sooner, freeing up time for each rep to spend with buyers that are actually interested in doing business with you.”
- Lost lead outcomes. Your CRM’s losses report can uncover the most common reasons for lost deals, and (gulp!) the total value of the deals you’re leaving on the table.
Real-world example: How Canva escaped the vanity metrics trap
Canva’s EMEA sales team faced a problem that sounds familiar: impressive-looking numbers that weren’t translating to predictable revenue.
Their teams logged thousands of calls. They tracked activity volume. They relied on individual sales rep intuition for forecasting. On paper, everything looked like it was working. In reality? Leadership couldn’t answer a simple question: “What are we actually doing right?”
The problem: Operating in a “black box”
As Jorge Bestard, Canva’s Head of Sales and Success for EMEA, explained: “Before it was a black box, we hoped that the messaging would work, but now we know if our reps are saying the things that they’re saying and we know its effect on win rates.”
Canva’s teams were measuring:
- Total number of customer calls made (activity volume)
- Number of activities logged
- Sales rep intuition-based forecasting
But they weren’t measuring:
- What was actually said during those calls
- Which messaging resonated with different buyer personas
- How specific talking points correlated with win rates
- Whether their forecasts were accurate
The shift: From “activity counting” to “evidence-based decisions”
Canva implemented Gong’s Revenue Intelligence platform to analyze actual customer conversations. Suddenly, they could answer questions like:
- “What messaging works best for a CIO versus a CTO?”
- “Which talking points correlate with closed deals?”
- “How quickly do qualified leads typically move through our pipeline?”
The results were immediate:
- 60% increase in rep and manager capacity to manage their book of business (without hiring more people)
- 6% revenue growth across the EMEA region in just one quarter
- Dramatically improved forecasting accuracy by combining rep intuition, sales methodology, and objective conversation data
The key insight? They stopped counting activities and started measuring what matters. They moved from hoping their sales strategy worked to knowing exactly which strategies drove results.
Canva’s transformation shows what happens when you stop chasing vanity metrics and start measuring real outcomes. More capacity. More revenue. More confidence. That’s the gap between vanity and actionable measurement.
Looking for an easy-to-use CRM with all the features you need to boost sales?
Nutshell has what you’re looking for.

Marketing vanity metrics examples
4. Total website visits
The size of your fishing net doesn’t matter if the net is full of holes. Since website traffic doesn’t directly correlate with marketing conversions, revenue, or even an effective strategy, the total number of monthly visitors or pageviews tells you very little by itself.
Plus, website traffic artificially rises and falls with the money you spend on online advertising. If your recent spike in traffic was bought and paid for in the form of keyword ads and display ads, it’s not a win worth bragging about.
Measure this instead: Engagement metrics
Engagement metrics such as visitor frequency (how often a person visits your website) and visitor recency (the number of days since a person’s last visit) can tell you whether or not your website is offering visitors something they’re genuinely interested in—or if it’s disappointing them when they get there.
5. New leads
Like website traffic, lead volume is something that can be artificially spiked with an increase in advertising spending. It’s also another metric that reflects potential more than results.
Marketing efforts should be focused on finding customers, not “leads.” If your team is finding new and creative ways to stuff more garbage-caliber leads into the top of your funnel, they’re focused on the wrong goals.
Measure this instead: Number of qualified leads
Your number of sales qualified leads should steadily increase if you hope to grow your business: How effective is your marketing team at attracting prospects that actually have a need for your product and the ability to buy?
If your lead volume is increasing but your sales aren’t, it means you need to do a better job of explaining the benefits of your product within marketing and advertising messages, and then placing those messages in channels where potential customers can find them.
6. Social media audience size and impressions vanity metrics
Social media followers are a dime a dozen. (Actually, they’re even cheaper than that if you buy them in bulk.)
True, having a large social media audience can suggest that your brand is regularly posting helpful, entertaining, and inspirational content to its social channels, but the intentions of your followers can be very diverse. Are they existing customers? Do they want to promote their own services? Do they want a job at your company? Are they doing some strategic stalking from a competitor’s office?
Even less impactful than audience size is impressions, or the number of times your content was displayed (regardless of engagement). According to Jacob Shwirtz, Global Head of Social Media Strategy at WeWork, keeping track of impressions isn’t worth your time. “Multiplying anything by the number of followers you have, or by an assumption of your average follower size, just doesn’t mean anything since we know that a tiny percentage of anyone’s following actually sees or cares about any given post,” Shwirtz says.
Measure these instead: Content shares and conversions generated by social media
To get a better handle on the impact of your social media selling efforts, keep an eye on these two metrics:
- Content shares: Social shares tell you that you’ve honed in on what resonates with your target personas, and that you’re consistently serving them content that they get excited about. “A share is a real vote of confidence, where someone took the time—and their personal credibility—to share that piece of content with their friends and followers,” Shwirtz says.
- Number of conversions generated by social media: The number of clicks generated by social media posts can be a vanity metric if those clicks aren’t taking visitors to any page where they could realistically convert into customers. Make sure that at least some of your social posts direct to website pages where visitors can complete a form to download a content offer or request more information. By fine-tuning the frequency and messaging of your social content, you can increase the number of people who land on your pages and convert into leads.
7. Newsletter subscribers
Email newsletters are often mis-measured—with subscriber growth being given more attention than the growth of resulting leads or revenue—and like social media accounts, companies often launch them without a coherent strategy, assuming that results will naturally follow.
The big mistake to avoid with newsletters is never asking for the sale. Sure, newsletters are important for customer nurturing and prospect education, but the end goal is to produce revenue through new or repeat business.
Measure this instead: New leads generated each month from your newsletter
If people are subscribing to your email newsletter because they’re interested in your company, you want to make sure that you’re actually using those newsletters to guide subscribers to a buying path. Keep in mind that effective newsletters don’t constantly try to sell—but when they do, they make the ask clearly and directly.
Increasing the number of newsletter readers who go on to engage with a member of your sales staff or otherwise express interest in your products can be done in two ways: 1) Making sure there are purchase CTAs both within the newsletter itself, and on any website page the newsletter links to, and 2) increasing the frequency of the newsletter. As long as you’re consistently offering value to the reader, there’s no reason your monthly newsletter can’t be increased to a weekly or even daily cadence.
Did we leave out your most despised vanity metric in sales and marketing? Leave a comment below, or tweet us at @nutshell!
How to start measuring what actually matters
Okay, so you’re convinced. Vanity metrics are holding you back. Now what? Here’s how to actually make the shift:
Step 1: Audit your current dashboard
List every metric you’re currently tracking. Next to each one, write down: “What decision would I make if this metric changed?”
If you can’t answer that question, it’s probably a vanity metric. Remove it.
Step 2: Define your business goals clearly
Pick 3-5 core business goals. Everything you measure should ladder up to one of these.
This sounds obvious, but it’s critical. Are you trying to:
- Grow revenue?
- Improve customer retention?
- Reduce sales cycle length?
- Increase deal size?
Step 3: Select 3-5 actionable metrics per goal
Each metric should directly correlate with your goal, be within your control (or mostly within your control), and be measurable consistently over time.
For revenue growth, that might look like:
- Conversion rate by pipeline stage
- Average sales cycle length
- Win rate
- Average deal size
For retention, it might be:
- Customer churn rate
- Net retention revenue
- Time to first value
- Support ticket volume
Step 4: Get your team on board
This is where Colleen Francis’s advice really matters: make sure your reps understand why the metrics changed. Explain how measuring quality over quantity, or conversion rate over activity, actually makes their jobs easier. Show them how it reduces busywork and focuses them on what closes deals.
Step 5: Use your CRM to track and coach
Your CRM should be your source of truth for metrics. Set up automated reports. Share them with your team regularly. Use them to identify coaching opportunities, not to play “gotcha.”
You probably won’t see a full cultural shift overnight. But like Canva did, most teams see measurable improvements within 30-60 days of making the change.
Frequently asked questions
-
1. How can I tell if a metric is vanity or actionable?
Ask three questions: Can this metric inform a specific decision? Can I reproduce the result intentionally? Does it reflect real business outcomes like revenue or retention? If you answer “no” to any of these, it’s likely a vanity metric.
-
2. Is email open rate a vanity metric?
Yes, especially since Apple’s Mail Privacy Protection (2021) artificially inflates opens by preloading emails. Focus instead on click-through rates, conversion rates, and time spent reading. These metrics show genuine engagement and connect directly to business outcomes rather than inflated technical triggers.
-
3. How do I convince my boss to stop tracking vanity metrics?
Show the disconnect between vanity metrics and revenue. Use your CRM to demonstrate how actionable metrics (like conversion rate by stage or customer acquisition cost) directly correlate with closed deals, while vanity metrics don’t predict business outcomes. Present side-by-side comparisons with real dollar impact.
-
4. Can vanity metrics ever be useful?
Yes, as context or leading indicators—not primary KPIs. Follower count might indicate brand awareness trends, and pageviews can signal content interest. But always pair them with actionable metrics that tie to revenue, and never make strategic decisions based on vanity metrics alone.
-
5. What’s the first step to transition from vanity to actionable metrics?
Audit your current dashboard and ask: “What decision would I make if this number changed?” Remove metrics that don’t drive action. Then identify your core business goals (revenue, retention, acquisition) and select 3-5 metrics that directly measure progress toward those specific outcomes.
Update: Thanks so much to Sales Pro Central for awarding this article a 2018 MVP Award for the best Sales Leadership content of the year! We’re truly honored!
 ONE TEAM. ONE TOOL.
Powerful email marketing, minus the headaches
Email Marketing plugs directly into your CRM data, so you can create highly targeted audience segments, track the impact of your emails in real-time, and manage all your communications out of a single tool. Get started for free!
 BACK TO TOP
 Written by
 Kevin Randolph Partnerships and Outreach Specialist
Ready to try
Nutshell for Free?Thank you! Your submission has been received!Oops! Something went wrong while submitting the form.


Introducing Revenue Booster, Our New Add-On for Getting the Most Out of Your CRM
Published on: August 11, 2023
Sales Performance Reviews: 9 Tips to Make Them Valuable
Published on: November 10, 2022Highly Effective Strategies for Elevating Sales Team Performance
Published on: November 10, 2022What Are the Top 3 Go-To-Market Strategies?
Published on: November 10, 2022Join 30,000+ other sales and marketing professionals. Subscribe to our Sell to Win newsletter!