Understanding Sales Reporting and KPIs

“Nutshell is super user-friendly and intuitive
“I would highly recommend Nutshell
“Easy to use and... wait for it ... 100% buy in!
“Nutshell is both simple and powerful
If you want to improve your sales performance and grow your business, you need reliable, relevant sales reporting and analytics.
Collecting, analyzing, and implementing insights from your sales reports provides benefits such as:
Track What Matters: Focus your reporting on meaningful sales KPIs like deal volume, win/loss rate, and lead response time to uncover performance gaps and optimize results.
Forecast for Smarter Growth: Use pipeline data and historical trends to anticipate future sales, align team efforts with quotas, and plan more effectively.
Turn Data Into Action: With customizable CRM reports and dashboards, sales and marketing teams can pinpoint what’s working, fix what’s not, and drive better decisions across departments.


Take our guided tour to explore Nutshell’s incredible features!

Sales reporting refers to collecting and analyzing sales data, compiling that information as well as insights about it, and presenting it in a format your team can use to stay updated on and improve sales performance.
Sales teams can use a wide range of data and reports so in this playbook, we’ll go over how to create a sales reporting plan, strategies for using sales reporting to reach and exceed your sales goals, and more.
Read through the guide for an introduction to sales reporting and analytics and check out the additional resources for more info on how you can use your sales data to reach the next level with your sales strategy.

When creating your strategy for sales reporting and analytics, one of the first things you’ll want to do is determine which key performance indicators, or KPIs, to track.
To identify your most important metrics, consider your sales team’s goals and choose the metrics that align best with your objectives. Choose KPIs that provide real insight into your progress toward your goals.
Once you determine which metrics you want to track, you can start thinking about which reports you want to create.
Some examples of key metrics that sales teams track include:
Check out these resources to learn more about sales metrics

Collecting sales data is the foundation of any sales reporting strategy. You need accurate data to get value from your sales reports.
Learn more about collecting data:
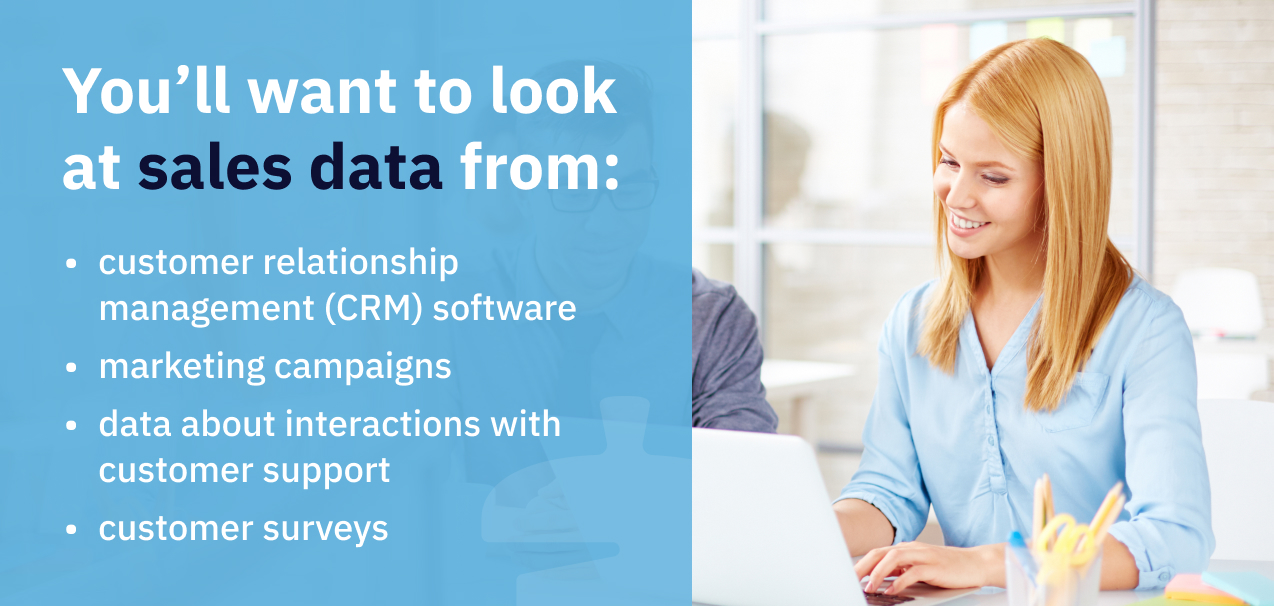
An important step is choosing the right sources for your sales data. You’ll likely want to use several sources to get a full picture of your sales performance. You’ll want to look at sales data from your customer relationship management (CRM) software and also consider data from your marketing campaigns, data about interactions with customer support, and customer surveys.

To establish a sales analytics system, you need to choose the right tools and processes for collecting, storing, and analyzing your data. Make sure you choose tools that are user-friendly, have the right features, and align with your sales team’s goals.
The most important tool you’ll choose is your CRM. Your CRM collects all of the data about your contacts in one place and can also help you with creating reports.
With Nutshell, for instance, you can view reports and dashboards about sales performance, lead volume, sales forecasts, your sales funnel, and more. You can filter your data to see the information you need and download ready-made charts you can use when presenting your data.
Learn more about collecting sales data:

Sales reporting enables you to share your data and insights with your sales team, other departments, and company leadership. Regularly providing easy-to-understand sales reports helps keep everyone informed and on track toward your goals.
Here are a few factors to keep in mind to help you make the most of your CRM reporting capabilities.

When determining your sales reporting plan, first consider the goals you want to accomplish with sales reporting. For example, you may want to keep your sales team aware of goals progress and inform your sales strategy.
Once you have your goals, ask yourself:
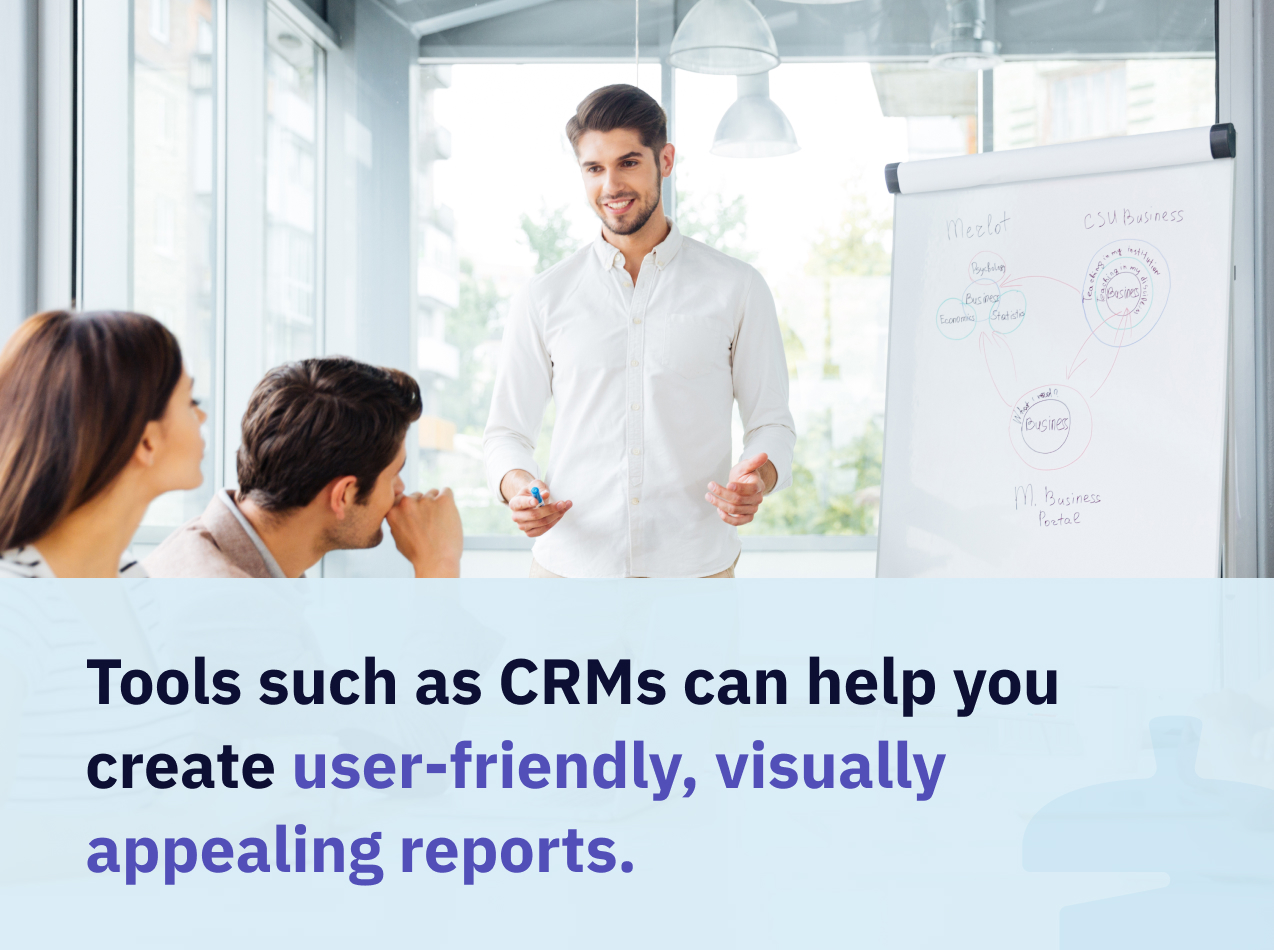
Presenting your sales reporting data in a way that makes it easy to understand and interpret helps your team get the maximum value from it. Use visualization techniques such as charts and graphs and choose presentation methods that make it easy for your team to get the information that matters most to them. Tools such as CRM management software can help you create user-friendly, visually appealing reports.
Check out these sales reporting resources to learn more:
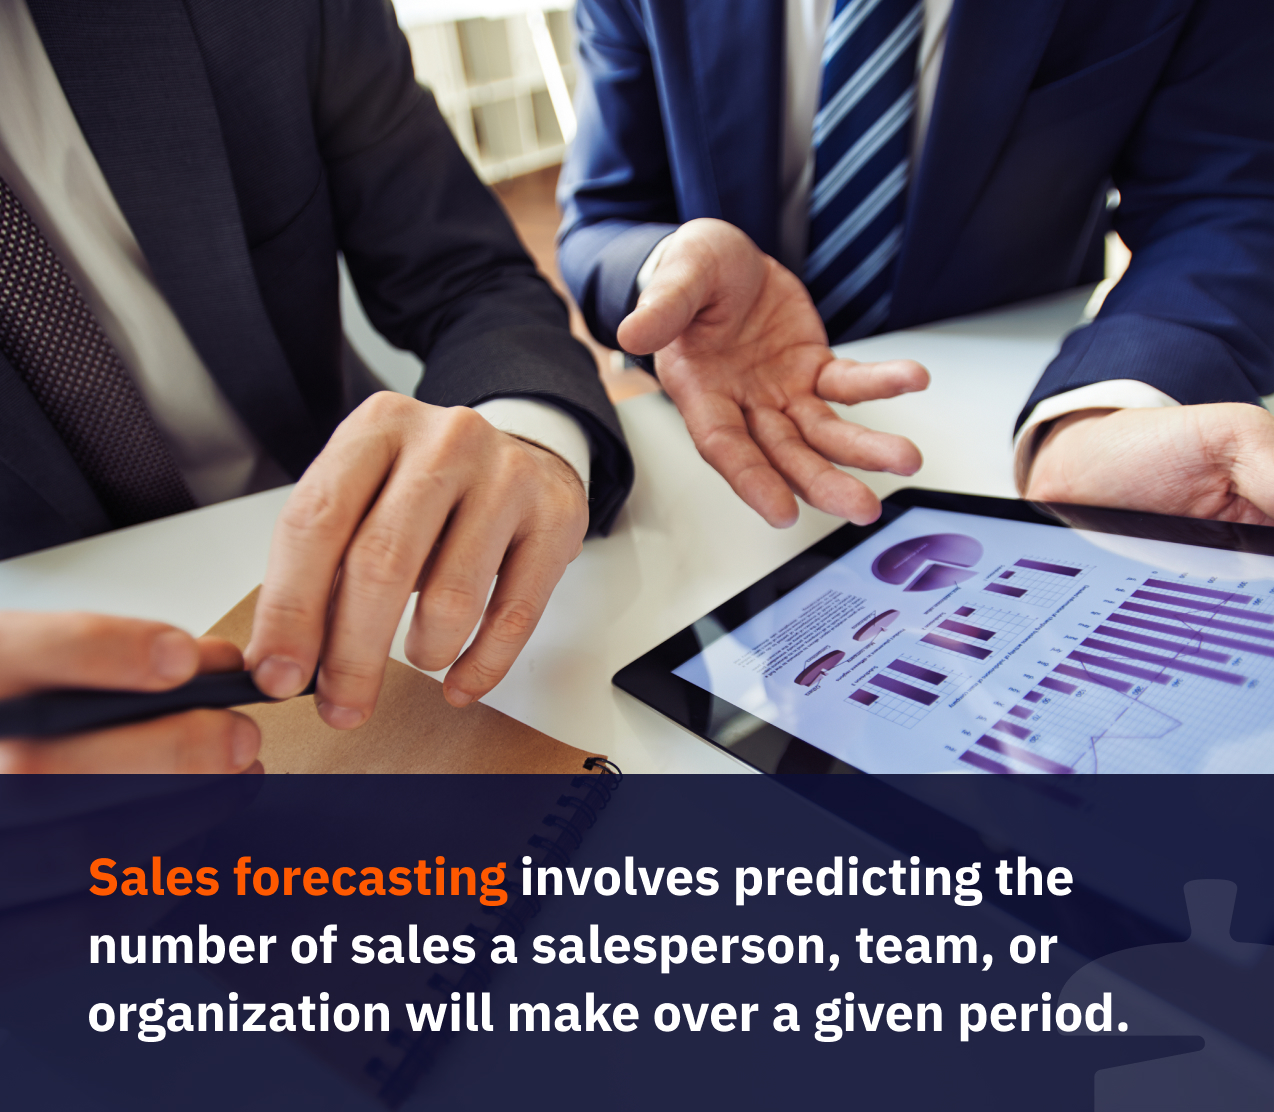
One of the most valuable ways to use your sales data is for sales forecasting, which involves predicting the number of sales a salesperson, team, or organization will make over a given period. Sales are typically forecasted using past sales data.
Sales forecasts are important because they reveal whether you’re on track to hit sales goals, allowing you to adjust your strategy accordingly. They also enable businesses to prepare for likely increases or decreases in sales by adjusting hiring, marketing budget, product manufacturing, and other areas.
Learn more about how to forecast sales with these resources:

Of course, to make all this reporting worthwhile, you need to know how to use it to grow your business. Let’s dive a little deeper and look at some of the ways you can use your sales data to uncover opportunities for growth, identify potential challenges, and improve your sales performance.
Learn more about leveraging sales data for growth:
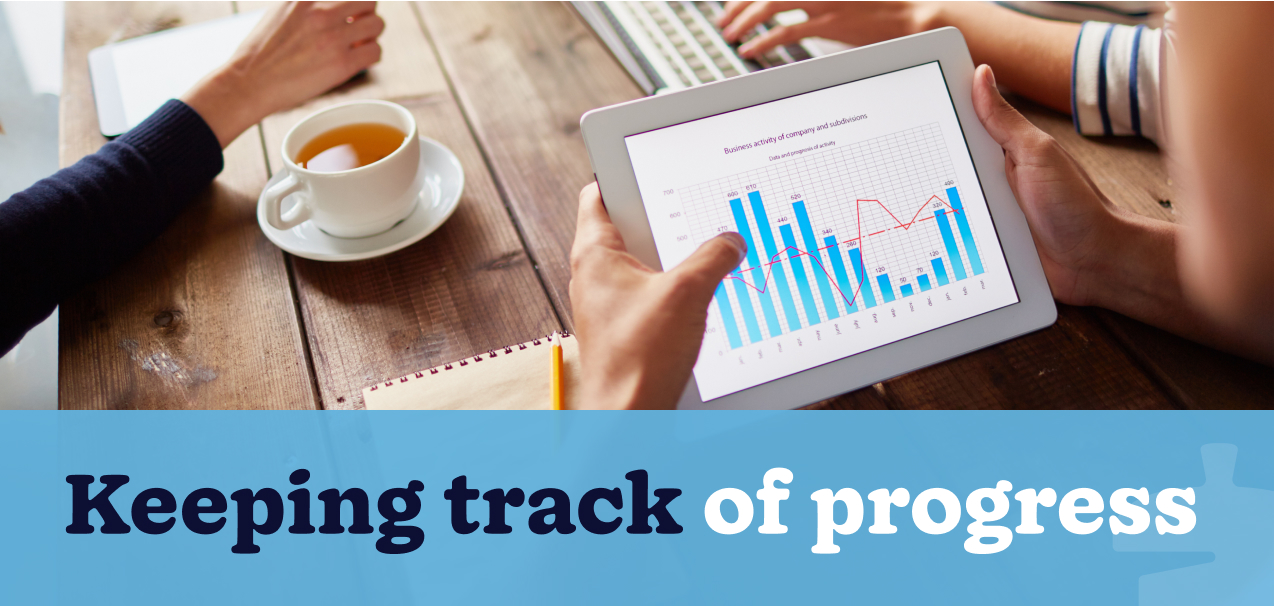
Sharing sales data, insights, and forecasts with your sales team can significantly improve their performance. Sales analytics helps ensure sales teams know what’s working well and if they’re on track to hit their goals, enabling them to adjust if needed. Keeping close tabs on sales can also help to keep your team motivated.

Analyzing your sales data can help you identify which parts of your sales process are working well and which need improvement. For example, you might find that you’re losing a lot of leads at a specific point in your sales funnel. You can then experiment with changing your sales activities during that stage until you see improvements.

You can use your sales data to identify and prioritize the customer segments that best fit your business and discover potential new markets and segments. You can also use your data to adjust your sales process based on different types of leads.
For example, when looking at your data on leads won and lost, you may discover that businesses in certain industries are much more likely to convert. You might also find, for instance, that your B2B leads respond better to phone calls while B2C companies prefer email.

It can be valuable to look at your sales data over longer periods to identify larger-scale trends and patterns. These sales analysis might reveal changes in where your leads are coming from or the types of leads who convert, for example.

To make the most of your sales reports, you should share them with other departments such as marketing and finance. This can help make your business more productive and efficient overall.
For example, when marketing knows which leads convert best, they can focus more on similar leads that are more likely to convert. Sales forecasts can help finance plan future spending and assist hiring managers in determining how many team members to hire.
Sales reporting summarizes past performance using structured data like charts and dashboards—it answers “what happened.” Sales analytics digs deeper to uncover patterns and insights, answering “why it happened” and “what to do next.” Both work together: reporting tracks progress while analytics drives strategic decisions.
It depends on your goals and team size. Daily reports work for tracking activity metrics and pipeline changes. Weekly reports help monitor progress toward quotas. Monthly and quarterly reports are best for strategic planning and forecasting. Start with weekly reports, then adjust frequency based on what your team actually uses.
Start by identifying the root cause—common issues include duplicate records, missing fields, or inconsistent data entry. Implement data validation rules, standardize input formats, and schedule regular data audits. Train your team on proper CRM hygiene and consider using data enrichment tools to fill gaps automatically.
Make it valuable and easy. Show reps how reports help them hit quota faster. Provide role-specific training and pair new users with CRM champions. Celebrate wins based on CRM data and gather regular feedback to improve workflows. When leadership actively uses reports, adoption follows naturally.
Yes! Nutshell offers automated reporting and customizable dashboards that update in real time. You can schedule reports to be delivered automatically, set up custom filters, and create visualizations without manual data entry. This saves 10-15% of your team’s time while ensuring everyone has access to current data.
If you want to improve your sales performance and grow your business, a well-designed sales reporting and analytics strategy is essential.
A key part of that strategy is having the right CRM to help you manage your data, uncover insights, and report on your progress. With Nutshell, it’s easy to keep track of your sales data, find the information you need, and create easy-to-read reports.
Start your free trial today to experience how Nutshell simplifies sales reporting for your team!
Join 30,000+ other sales and marketing professionals. Subscribe to our Sell to Win newsletter!