14 Essential KPIs for Sales Managers to Track and Improve
-

Quick answer: What are the most important sales manager KPIs?
The most important sales manager KPIs include revenue and quota attainment, win rate, average deal size, sales cycle length, pipeline value and velocity, and activity metrics like calls and meetings. These metrics help sales managers identify performance trends, spot coaching opportunities, and forecast accurately. The best sales managers track both outcome metrics (revenue, deals closed) and activity metrics (calls made, proposals sent) to understand what’s driving results and where their team needs support.
Key takeaways
-
Sales KPIs—like customer lifetime value, win rate, and lead response time—are essential for aligning your sales team’s activity with business goals and driving growth.
-
Choosing the right KPIs starts with setting SMART goals, limiting your focus to a few meaningful metrics, and involving your team to ensure buy-in.
-
Consistent tracking using CRM tools like Nutshell helps automate reporting, maintain data accuracy, and translate insights into action.
Tracking the right KPIs for sales managers is essential for leading a high-performing team, forecasting accurately, and identifying coaching opportunities.
Recent insight from McKinsey & Company shows companies that implement data-driven B2B sales engines – that is, systematic KPI tracking – experience a 15% to 25% increase in EBITDA (Earnings Before Interest, Taxes, Depreciation, and Amortization).
Keep reading to learn the KPI meaning in sales for representatives and teams, why they’re helpful, how to choose the right ones, and how to track them.
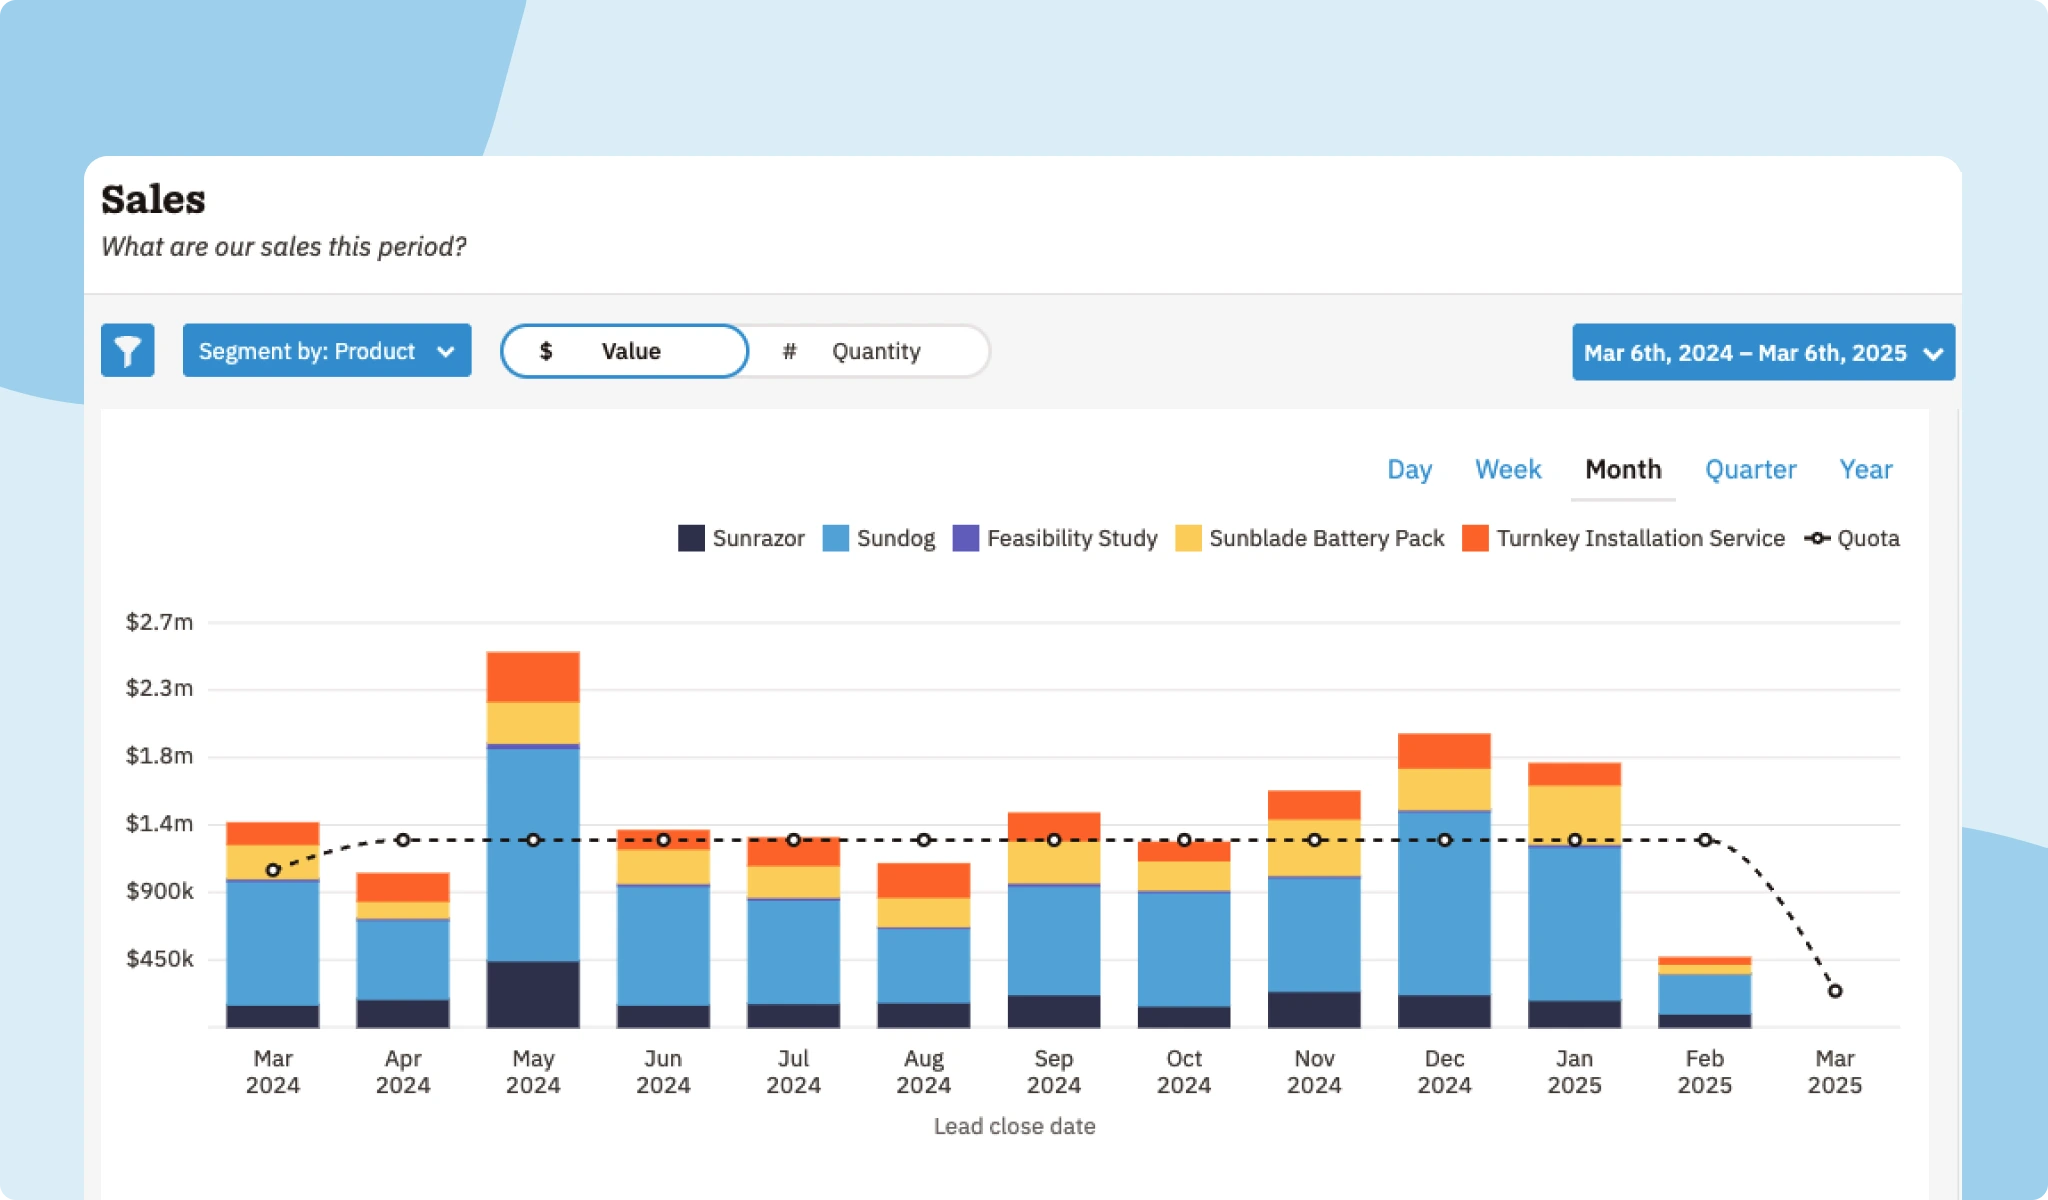
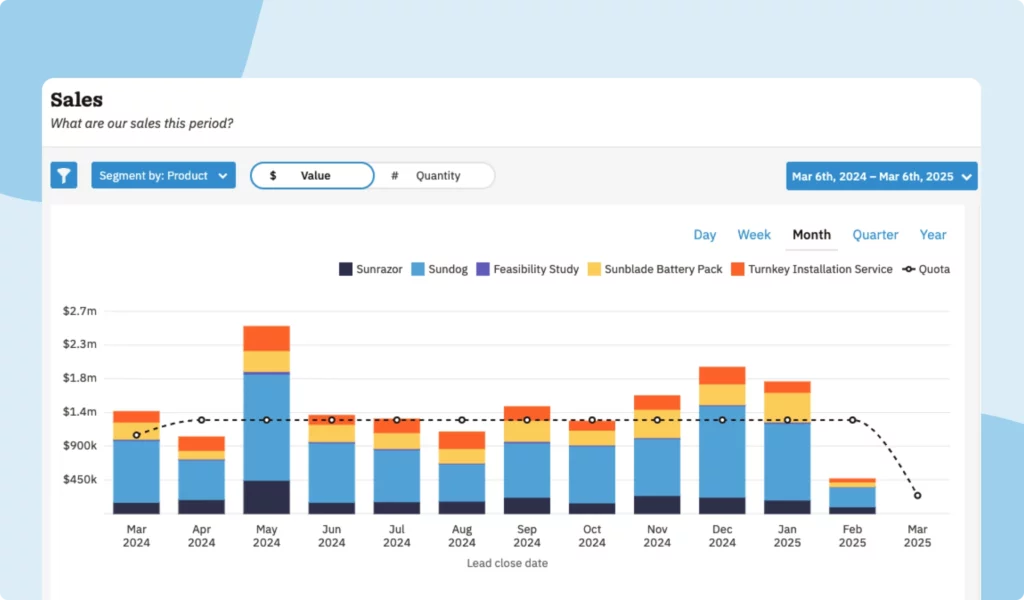
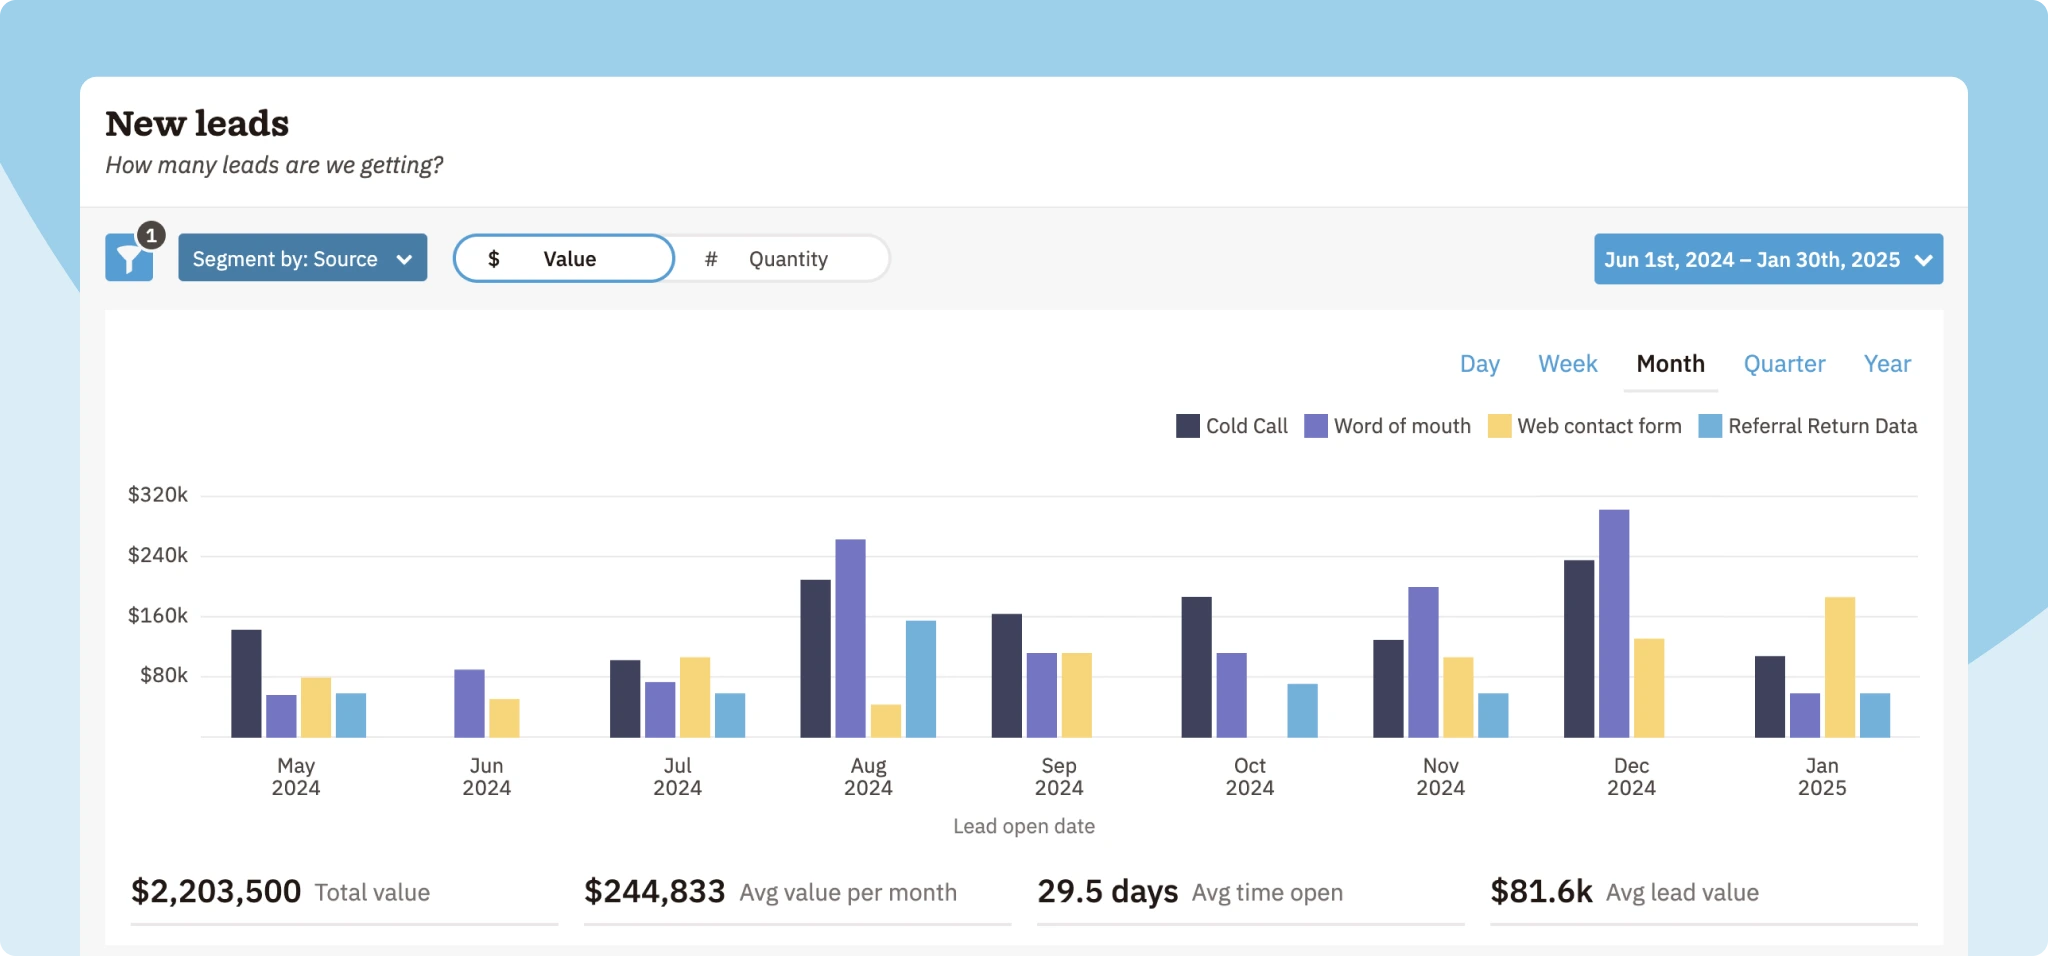
Monitor your sales KPIs effectively!
The Nutshell Sales dashboard tracks all your key sales metrics—pipeline health, win rates, sales revenue, quotas—so you can coach your team to success!

What are KPIs in sales?
When new managers ask what is kpi in sales, the answer is straightforward: Key performance indicators for sales, or sales KPIs, are metrics used to track the progress of sales teams toward their goals and measure their performance’s impact on overall business objectives. Sales KPI format examples include customer lifetime value, conversion rate, and number of new leads.
Sales KPIs vs. sales metrics
KPIs and sales metrics are similar, but they’re not exactly the same thing. Essentially, KPIs can be metrics, but not all metrics are KPIs.
Like KPIs, metrics are quantifiable measures of business functions. What sets KPIs apart from other metrics is the fact that a KPI for sales is designated as the most important measure of progress toward the most significant goals.
Why should sales managers track KPIs?
Tracking sales KPIs gives your team a crystal-clear view of performance and its impact on the business. In fact, companies that embrace data-driven sales KPIs see measurable lifts–a Harvard Business Review study found data-driven sales teams achieved 5–6% higher productivity than their peers.
Even in an SMB with a small team, the right KPIs turn raw data into actionable insights for growth. A ZS study of 250 mid-market B2B firms showed that firms growing at an annual rate of 20% or more have better intentionality with their KPIs—they review more frequently, track more metrics, and share them more widely across the organization.
Here are some of the key benefits of tracking sales KPIs.
KPIs keep you focused on your most important objectives
Since KPIs make progress toward your most important goals measurable and easily visible, they make it much easier to ensure you’re on track toward meeting them. KPIs ensure you’re using meaningful sales metrics to track your success.
KPIs prevent information overload
With so much data now available to businesses, it’s easy to get overwhelmed. KPIs help your team focus on the metrics that truly matter and avoid information overload so you can actually make use of your data.
KPIs turn abstract goals into measurable targets
Even if your team knows its goals, unless you break them down into measurable targets, it’s hard to know whether you’re on the right track. Keeping an eye on sales efficiency metrics and KPIs for sales team members enables you to turn abstract goals into something you can measure.
KPIs help you achieve results faster
Since KPIs help improve focus, they often enable you to get quicker results. With well-defined KPIs in place, you’ll spend less time on tasks that don’t make as much meaningful impact and stay better focused on the most critical tasks.
KPIs provide insight into business performance
Keeping an eye on KPIs for sales can also reveal trends and shine a light on what’s working well and what needs improvement. Sales managers can use this information to improve sales performance by shifting focus, offering guidance to their team, and adjusting strategies.
KPIs facilitate sales representative accountability
KPIs also boost accountability on the sales team. By regularly reviewing progress with the group and letting each rep see and discuss their metrics, you create shared responsibility for hitting targets. Research supports this–frequently monitoring goals greatly increases the likelihood of achieving them.
Download our Sales Manager’s Survival Guide!
Ready to become the best sales manager for your team? Get 70+ leading tips and strategies from the experts for sales management success with our Sales Manager’s Survival Guide.
How to choose the right sales KPIs
To track KPIs that will benefit your business, you need to make sure you choose the right ones. These tips will help you pick the sales KPIs that matter most for your team.
1. Start with your goals
Before you can choose KPIs, you need to understand what your most important objectives are. Work with company leadership and others in your organization to determine the most meaningful goals and top priorities for your company and choose KPIs that will make the most impact on achieving those goals.
2. Determine how to make those goals measurable
When it comes time to define your KPIs in more detail, use the SMART framework to make your goals as useful as possible for your team. The SMART framework advises you to create goals that are:
- Specific: More detailed goals are easier to track and provide a more focused target to aim for. Your KPIs should lay out specific numbers your team will aim for, such as a specific revenue number to hit or a percentage increase in new sales or leads.
- Measurable: Have a plan in place for how you’ll measure progress toward your goals. A CRM and other software tools can help you with this.
- Achievable: Your targets should be realistic while still providing meaningful growth when you hit them.
- Relevant: Ensure the targets you set align closely with your company’s most important objectives. This helps you avoid vanity metrics.
- Time-bound: Set a time frame for your goals to help keep your team on track. For example, you could set a goal to increase sales by a certain percentage each quarter.
3. Narrow it down to just a few key metrics
You probably have a long list of sales metrics you’d like to track, but it’s better to focus on just a few key KPIs that will have the most impact on your top objectives.
The McKinsey report mentioned above highlights the risk of “too much data and no focus.” Organizations often drown in metrics without seeing actionable insights.
The cure? Focus on a few high-impact KPIs that directly align with growth and revenue objectives. This will help keep your team focused and help you get the most meaningful results.
Tying your sales metrics to your overall business goals prevents you from wasting resources on activities that don’t contribute to these goals. It also ensures that your sales team contributes to your organization’s success in a meaningful way.
Proper sales and company goal alignment improves your team members’ understanding of the business’s priorities. This encourages a more cohesive sales approach and makes it easier for the business to achieve its goals.
4. Involve your team in the selection process
As a sales manager, you likely understand the day-to-day goals and metrics your team aims for. But you may also have blind spots that your team members see more clearly.
It helps to involve your team members in deciding which KPIs matter most and which ones–when improved–will result in the most drastic sales growth. And when team members get a say in deciding KPIs, they’re less likely to be resistant to tracking them.
How to track and report on sales KPIs
Once you’ve chosen your KPIs, you’ll need to create a solid tracking and reporting system. These tips will help you keep track of your KPIs.
1. Identify who will track each KPI
To make sure your team tracks all the necessary sales KPIs, you’ll need to determine who is responsible for each one. This person will manage tracking, report on progress, and help identify any issues or roadblocks related to the KPI.
2. Create a reporting plan
For each KPI, decide which reports you’ll use to track it, how often you’ll create them, and who you’ll share them with. Creating this plan will help keep you on track and ensure you don’t lose sight of your progress.
3. Establish a regular review cadence
Organize a regular time to review your progress on your KPIs and facilitate round-table discussions on how to improve going forward. Depending on the metrics you’re measuring, you can review at a cadence of weekly, monthly, or quarterly.
4. Choose the right tools
Another key to success when it comes to sales KPIs is ensuring you have the right tools for tracking and reporting.
A customer relationship management (CRM) system is essential for tracking sales data. With Nutshell, for instance, you can:
- Automatically track sales performance
- Monitor leads
- Analyze how customers move through your sales funnel
- Download presentation-ready charts
- And much more
Experience powerful reporting & analytics in Nutshell
Learn more about Nutshell’s reporting and analytics features
14 important KPIs for sales managers
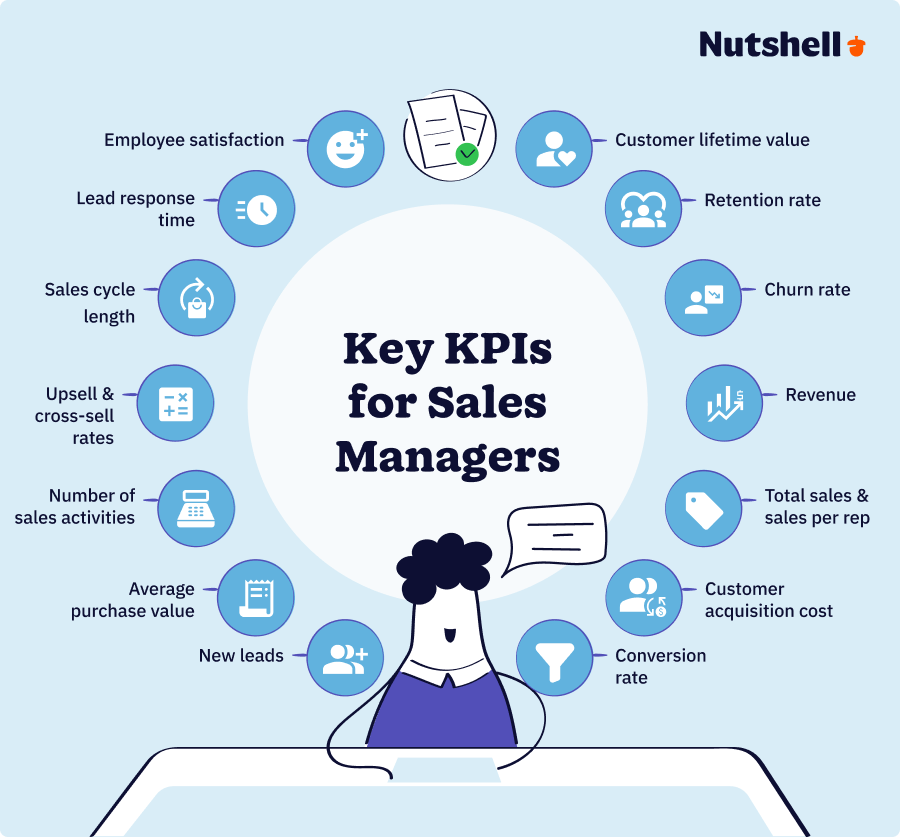
So, which KPIs should you measure as a sales manager? You’ll want to choose ones tied to your unique objectives, but here are some of the common and essential sales KPIs.
14 Sales Manager KPIs
- Customer lifetime value (CLV)
- Retention rate
- Churn rate
- Revenue
- Total sales and sales per rep
- Customer acquisition cost (CAC)
- Conversion rate
- New leads
- Average purchase value
- Number of sale activities
- Upsell and cross-sell rates
- Sales cycle length
- Lead response time
- Employee satisfaction
1. Customer lifetime value
Customer lifetime value (CLV) is the total income a company brings in from a typical customer over the entirety of their time as a customer. Examples of this salesperson KPI include the value of initial purchases, renewals, upsells, cross-sells, and any other income.
CLV is crucial because it shows how much revenue a company can expect to earn over the long term and how much each customer is worth to the business. It can also shine a light on customer fit, customer retention efforts, and more.
CLV formula:
CLV = (average transaction size) x (average number of transactions) x (retention period)2. Retention rate
Customer retention rate measures the likelihood your business will keep customers over a given period.
A low retention rate might indicate poor customer fit or dissatisfaction with your product or customer support. Tracking the retention rate can help you catch these issues and make changes to retain more customers.
Customer retention rate formula:
Customer retention rate = (Customers at the end of a period) – (new customers gained) / customers at the beginning of a period
3. Churn rate
The churn rate is essentially the flip side of the retention rate and measures the rate at which a business loses customers.
Most of your revenue likely comes from existing customers, and it’s much more cost-effective to keep a current customer than gain a new one. So, while every business has some churn, tracking your retention or churn rate is essential.
Customer churn rate formula:
Customer churn rate = (customers at beginning of period – customers at end of period) / customers at beginning of period
4. Revenue
Tracking revenue as a KPI may seem obvious, but it’s an extremely useful and flexible metric.
Revenue is a great way to track the overall success of your sales team and your business. You can also break it down by sales rep to get insights into individual sales performance.
If your business is subscription-based, you may want to measure monthly recurring revenue (MRR) and annual recurring revenue (ARR). Examples of this salesperson KPI type include income from subscriptions, upsells, and cross-sells and consider discounts and cancellations. They provide a measure of the revenue that a business can reliably expect to generate each month or year.
5. Total sales and sales per rep
A great sales efficiency metric to include is the total sales per rep. Tracking total sales over time provides insight into sales growth and trends and enables you to keep your team on track toward hitting sales targets.
Tracking sales per rep can help managers to improve individual sales performance, and sharing these sales statistics can help motivate team members to hit their goals.
6. Customer acquisition cost
Customer acquisition cost (CAC) is the total cost of gaining one new customer. These costs typically include costs for sales, marketing, and overhead and can be looked at on an overall or campaign basis.
Sales teams can have an even more significant impact on a company’s profitability by working to reduce CAC in addition to increasing revenue.
Customer acquisition cost formula:
CAC = Total sales and marketing costs / number of new customers
7. Conversion rate
Conversion rate, also called customer acquisition rate or win rate, is a measure of how many leads become customers.
Looking at this metric for your sales team as a whole gives you insight into the effectiveness of your sales strategies and tactics.
For example, you could look at the win rate for customers who participated in a demo compared to those who just had a sales call. If demos led to higher conversion rates, you could then focus more on getting demo signups.
You can also look at conversion rates on an individual basis. If you notice some sales reps have higher win rates, you can look into the tactics they use and then encourage the rest of the team to use those techniques as well.
8. New leads
Another relatively simple but important KPI for sales managers is the number of new leads gained during a given period.
You can calculate how many new leads you’ll need to reach your sales goals based on your typical conversion rates. If the number of newer leads is lower than expected, you can shift focus to spend more time on prospecting.
9. Average purchase value
Average purchase value is the average amount that customers spend on a transaction with your business. This metric is closely tied to revenue and CLV.
Increasing average purchase value enables you to earn more revenue from your existing leads and customers. When sales managers track average purchase value, they can use the data they collect to develop strategies that encourage customers to spend more.
10. Number of sales activities
Tracking the number of sales activities each rep completes in a given period can help sales managers understand their team’s productivity. These activities can include calls, emails, meetings, demos, and other tasks that may contribute to winning a sale.
To really understand sales performance, you’ll need to consider win rate, sales cycle length, and other metrics, but sales activities are a valuable part of the whole picture.
11. Upsell and cross-sell rates
If you want to increase revenue from your existing customers, it’s a good idea to track upsell and cross-sell rates.
Putting more focus on upselling and cross-selling is an excellent way to give your revenue a boost. Tracking these metrics helps you determine what techniques are working for winning upsells and cross-sells.
Cross-sell rates and upsell rate calculations follow a similar formula, and can be calculated on either a revenue or number of customer basis.
*These formulas assume that upsells and cross-sells have been attempted on all customers. If not, simply replace the value of total customers/revenue with a more accurate number
Formula:
Revenue upsell/cross-sell rate = (Revenue generated from upsells/cross-sells / Total revenue generated) x 100
Customer upsell/cross-sell rate = (Number of upsell/cross-sell conversions / Total number of customers) x 10012. Sales cycle length
Another useful KPI for sales managers is sales cycle length.
By looking at which cycle lengths resulted in the most wins, highest values, and best customer retention rates, you can determine the ideal sales cycle length.
If certain sales reps are closing quality deals faster than others, other reps may be able to adopt their tactics to shorten their sales cycles.
13. Lead response time
Quickly responding to leads can have a significant impact on whether they’ll convert.
Tracking lead response time enables you to set response time goals and speed up your processes, which can help improve your win rate.
You can calculate lead response time with a two-step formula:
Time/date of new contact – Time/date of follow-up = Time (Min/Hrs/Days) to respond
Average lead response time = Sum of Time (Min/Hrs/Days) to respond for all contacts / Number of contacts14. Employee satisfaction
Another key KPI for sales managers is employee satisfaction. When your team is happy and motivated, they’ll perform better and enjoy being part of the team.
Sales managers can use surveys, meetings, and other feedback opportunities to gauge employee satisfaction and gather ideas for improving team culture and work environment.
Results from employee surveys can help you measure tangible KPI metrics, such as employee net promoter score (eNPS).
Calculating eNPS is similar to calculating NPS for customers:
- Send a survey to your employees with the question, “On a scale of 1-10, how likely are you to recommend our organization as a place to work?”
- Based on the responses, calculate the percentage of promoters (responses with a score of 9 or 10), passives (score of 7 to 8), and detractors (score of 1 to 6)
- Calculate your eNPS with the formula:
- eNPS = Percentage of Promoters – Percentage of Detractors
Another key metric to measure employee satisfaction is turnover rate. Ruling out external, non-work-related reasons, employee retention is a good indicator of employee satisfaction. The lower the turnover rate, the more ideal.
Turnover rate formula:
Turnover rate = ( Number of employee resignations during a period / number of employees at the beginning of the period ) x 100
Cheatsheet: Essential KPI types and their formulas
KPI Definition Formula Customer lifetime value (CLV) Total income generated throughout a customer’s lifetime (their time as your customer)Dollar amount CLV = (Avg transaction size) x (Avg no. of transactions) x (Retention period) Retention rate The average percentage of customers that you keep over a period Customer retention rate =(No. of customers at the end of a period – No. of new customers gained in a period)/ No. of customers at the beginning of a period Churn rate The rate at which your company loses customers over a specified period Customer churn rate =(No. of customers at the beginning of a period – No. of customers at the end of a period) / No. of customers at the beginning of a period Monthly Recurring Revenue (MRR) Predictable recurring income generated from customers on a monthly basis MRR =Total number of active customer accounts x Average revenue generated per account Annual Recurring Revenue (ARR) Predictable recurring income generated from customer on a yearly basis ARR =(Total subscription revenue generated in a year – Revenue lost from churn and downgrades
OR ARR =Monthly recurring revenue (MRR) x 12Customer acquisition cost (CAC) The sales and marketing cost of convincing potential customers to buy a product or service from your company CAC =Total sales and marketing costs/ Number of new customers Conversion (Customer acquisition) rate / Win rate The rate at which leads are converted into customers Conversion rate =( No. of customers acquired in a given period / Total no. of leads generated in a given period ) x 100 Average purchase value The average amount that customers spend when buying from your business Average purchase value =Total value of sales generated in a given period / Number of sales made Upsell rate The rate of successful upsell attempts in a given period (on a customer count or dollar value basis) Upsell rate (Revenue) =(Revenue generated from upsells / Total revenue generated) x 100
Upselll rate (Customer) =(No. of upsell conversions / Total number of conversions) x 100Cross-sell rate The rate of successful cross-sell attempts in a given period (on a customer count or dollar value basis) Cross-sell rate (Revenue) =(Revenue generated from cross-sells / Total revenue generated) x 100
Cross-selll rate (Customer) =(No. of cross-sell conversions / Total number of conversions) x 100Lead response time The average time–measured in minutes, hours, or days–it takes for sales reps to follow up with leads 1. Time to respond =Time/date of new contact – Time/date of follow-up
2. Average lead response time =(Sum of Time to respond off all contacts / Number of contacts) x 100Employee net promoter score (eNPS) The average satisfaction rate based on how likely they would recommend your business as a good workplace eNPS =Percentage of promoters – Percentage of detractors Turnover rate The rate at which employees terminate their work contracts Turnover rate =(No. of employee resignations / no. of employees) x 100 Common sales KPI tracking challenges
Tracking your sales KPIs effectively doesn’t have to be complicated. However, sales managers often face KPI tracking obstacles when teams don’t follow the best practices we’ve detailed above.
Here are a few of the most common sales KPI tracking challenges your team might come across and how you can overcome them.
Poor data quality
Without accurate data, your sales metrics are doomed from the start. Low-quality data leads to inaccurate reporting and forecasting, which could spell severe financial problems for any business.
Inaccurate, inconsistent, or incomplete data capturing is typically at the heart of a data accuracy issue. These can lead to duplicated, incorrect, and outdated information, making KPI tracking an uphill battle.
Establishing a structured data-capturing process and assigning specific individuals to data quality control is a good idea. A regular data cleaning routine will also help ensure your KPIs and metrics remain accurate and relevant.
Lofty KPI targets
If you set unreasonable KPI targets, your team will have a tough time achieving their goals, which could threaten your business. When sales teams continually fail to meet their objectives, demotivation sets in, which could lead to your sales reps looking for work elsewhere.
Setting SMART goals is one of the cornerstones of keeping your sales team motivated and on track. While we’d all like to double our profits in the shortest possible time, setting KPI targets based on what your team can actually achieve will get you there faster.
Lack of management
Data management is critical, even for a small sales team. Ensure someone (even if it’s the sales manager) is assigned to keep data clean and updated in your CRM.
In many small sales teams, one person wears multiple hats–but having a point person for data quality and reporting ensures you can trust your KPI dashboards.
With consistent data hygiene, your sales metrics stay accurate and actionable, allowing you to spot trends and coach your team in real time.
Resistance to change in tracking methods
Whether it’s a process or software, you can expect to meet resistance to anything new. You or your team members may see KPI tracking as a waste of time you could be spending on sales and lead nurturing.
It’s important to make the tracking process as simple as possible, as well as to create a habit of it that takes no more than one or two hours a week.
Trends to look out for: Sales KPIs and metrics tracking in 2025 and beyond
Great KPIs keep track of your sales team’s performance, helping you to troubleshoot and grow in the right direction. But while the metrics are keeping you in line, who’s keeping the metrics in line?
Here are a few trends in KPI and metrics tracking to watch out for in 2025 and beyond.
The AIR Framework
Structuring your KPIs into Activities, Indicators, and Results (cleverly abbreviated to AIR) helps your team act proactively—not reactively—by connecting effort (activities) to outcomes.
- Activities: KPIs based on and affected directly by activities done by your sales team. Examples include number of sales activities per rep, calls/emails made, or number of new business meetings.
- Indicators: KPIs that indirectly indicate a trend towards a desired result. Indicators include KPIs such as sales cycle length, pipeline velocity, and forecast accuracy.
- Results: Outcomes that affect the bottom line. Examples include monthly bookings, deal size, lead-to-sale conversion, and revenue.
Meta-KPIs
With AI integrating into CRM and other sales-related tools in 2025, companies will likely begin tracking meta-KPIs—the ROI of autonomous AI decision-making in sales and marketing.
In other words, rather than measuring, say, the conversion rate of a given month, you’d also measure the ROI of AI tools used (such as automated follow-ups or predictive analysis) to optimize revenue rates for that month.
Sales KPI FAQs
What’s the difference between KPI and KRA in sales?
Sales-related key performance indicators (KPIs) describe particular sales metrics used to evaluate performance against set targets and goals. However, key responsibility areas (KRAs) in sales are the core functions and responsibilities of your sales representatives.
Is a sales target the same as a sales KPI?
Not exactly. Sales managers will set specific KPI targets for sales teams to track goals and encourage a higher level of performance, making each target an essential kpi for sales manager tracking. Sales efficiency metrics and KPIs for sales are used to gauge performance and its impact on the business.
What is the meaning of “qualitative KPIs” in sales?
A qualitative KPI is non-numerical data used as a value of measurement but based on information that is more subjective or related to an opinion. For example, your business’s overall customer satisfaction level is not represented by a numerical value and would be considered a qualitative KPI.
What are KPIs for sales?
KPIs for sales—sales key performance indicators—are metrics used to track the progress of sales teams toward their goals and measure their performance’s impact on overall business objectives.
How do you calculate KPIs for sales?
Calculations for sales KPIs depend on the specific metric that you’re tracking. It could be a number you track on a monthly or yearly basis (revenue, new leads, or total sales per rep).
You could also calculate a KPI with a formula, such as for customer acquisition cost (Total sales cost / Number of new customers) or customer lifetime value (Average transaction size x Number of transactions x Retention period).
What are the 5 key performance indicators?
There aren’t five universal key performance indicators, but there are a few staple KPIs for tracking sales that benefit numerous industries. For example, revenue-based KPIs (such as ARR and MRR), cost-based KPIs (such as CAC), and company KPIs (employee satisfaction) affect both sales and marketing departments, so keeping track of these can help you achieve and maintain business growth.
How can sales KPIs be improved?
The first step to improving a KPI is to track and measure it accurately. With true data in hand, you can then assess the activities (or non-activities) that led you to the results you have.
Then, to get the KPI result, you can change the actions that affect the outcome. Give the new actions time to yield results, measure, and adapt as necessary. Rinse and repeat for any other KPIs.
What are some examples of sales KPIs?
Common examples of sales KPIs include customer lifetime value (CLV), customer churn, customer retention, MRR/ARR, and customer acquisition cost (CAC).
Ready to make tracking KPIs for sales reps and teams easier?
Once you’ve selected the right sales KPIs and set up a system to track them, you’re on your way to helping your team achieve its sales goals and making a significant impact on your organization.
Having the right tools is essential for tracking and reporting on KPIs, and Nutshell is here to help. When you choose Nutshell as your CRM, you’ll get automatic sales data tracking, customizable dashboards, and flexible, easy-to-use reports. Give it a try today with a free 14-day trial.
See Nutshell in action!
Give our powerful, easy-to-use CRM a try for free for 14 days! Or join a live demo to see Nutshell at work!
 BACK TO TOP
Ready to try
Nutshell for Free?Thank you! Your submission has been received!Oops! Something went wrong while submitting the form.


19 Best Email Testing Tools to Help You Drive Revenue (And Avoid Embarrassment)
Published on: November 10, 2022
Sales Performance Reviews: 9 Tips to Make Them Valuable
Published on: November 10, 2022Highly Effective Strategies for Elevating Sales Team Performance
Published on: November 10, 2022Join 30,000+ other sales and marketing professionals. Subscribe to our Sell to Win newsletter!