Best CRM Reporting Software: Definition, Types, Benefits, and Top Solutions Compared
-

Key takeaways
-
The best CRMs offer detailed insights into lead sources, deal progress, losses, and forecasting—empowering teams to improve conversion rates and identify what’s working across the funnel.
-
CRMs like Nutshell prioritize customizable reports and real-time dashboards, allowing sales and marketing leaders to tailor metrics to their unique goals and make timely, data-driven decisions.
- Each featured CRM (e.g., Zoho, HubSpot, Insightly) offers different strengths—from ease of use to advanced analytics. The right choice depends on your team size, sales complexity, and reporting depth required.
Tracking your contacts and conversations isn’t the only task a CRM is good for. Choosing the right CRM with powerful reporting capabilities can save you a ton of time in analyzing your sales numbers and creating your financial forecasts for the future.
A study by IBM found that the ability to consolidate sales data was one of the top four most important features that businesses wanted out of a CRM. These sales data reporting tools help gather and organize customer data and offer invaluable insights into your audience, shaping your business strategies.
But, not all CRMs are built the same. Some CRMs offer better reporting features than others, so choosing the right CRM can impact everything from your sales process to your productivity.
In this article, we’ll examine the CRMs with the best sales reporting capabilities, the key CRM reports you should monitor, and the valuable insights each one can provide.
Table of contents
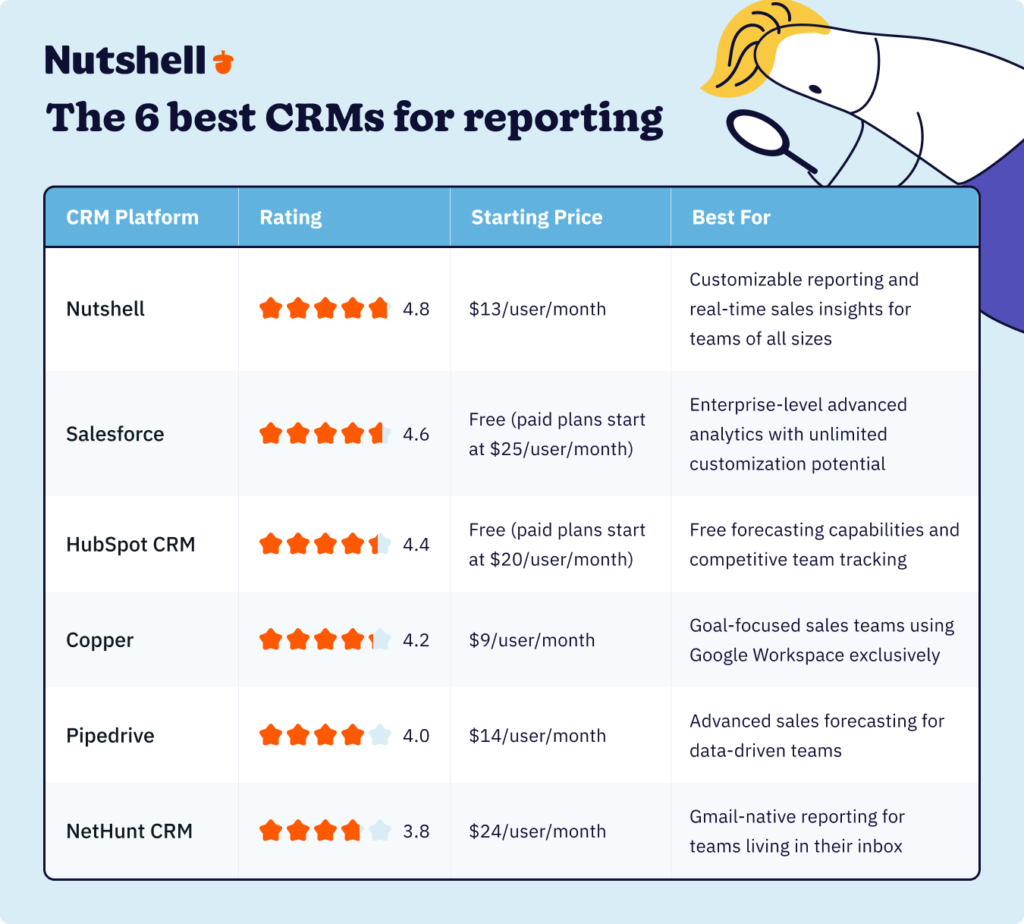
- The 6 best CRMs for reporting, at a glance
- What is a CRM report?
- How CRM reports benefit businesses
- How we evaluated these CRM reporting platforms
- 6 CRMs with the best reporting features
- Types of CRM reports
- How to choose the right CRM reporting software for your business
- Key features to consider in CRM sales reporting and analytics
- Frequently asked questions
The 6 best CRMs for reporting, at a glance
Here’s a quick overview of our top picks, ordered by overall rating:
- Nutshell: Best for customizable sales reporting with real-time insights across the entire sales cycle
- Salesforce: Best for enterprise-level advanced analytics with unlimited customization options
- HubSpot CRM: Best for free forecasting and competitive team tracking through rep leaderboards
- Copper: Best for goal-focused sales teams deeply integrated with Google Workspace
- Pipedrive: Best for advanced sales forecasting with visual pipeline management
- NetHunt CRM: Best for Gmail-native reporting workflows without leaving your inbox
What is a CRM report?
A CRM report is a tool within your CRM platform that provides you with different datasets in an easy-to-read format for analysis. The data present in these reports is derived from sales and marketing activities recorded in your CRM.
This CRM sales reporting software allows users to draw custom reports for deeper data evaluation, helping businesses pinpoint trends and opportunities. Generating CRM reports regularly will enable sales and marketing managers to keep track of their most important KPIs to ensure their teams meet monthly, quarterly, and annual business goals.
Sales and marketing teams can create CRM reports in the form of graphs, charts, and more, making data analysis easier.
How CRM reports benefit businesses
While you might already have a handle on several critical aspects of your organization, analyzing your customer, sales, and marketing data will truly reveal the effectiveness of your current processes.
In fact, leaning on CRM reporting and analytics for deeper operational insights can provide significant business benefits, including:
- Assess overall performance: Drawing reports from your CRM system gives you an overview of sales and rep performance, which you can then analyze and benchmark.
- Increase team efficiency: With CRM reports, you can quickly identify roadblocks and ensure team members are on the same page, helping them move forward toward their goals more efficiently.
- Promote data-driven decisions: CRM sales reporting opens the door to deeper data analysis, revealing insights teams and managers can use for more strategic decision-making.
- Improve customer experiences: Your reports organize customer data in a way that offers a greater understanding of customer trends and behavior, allowing you to optimize sales, marketing, and service strategies.
- Determine your ICP: Using the data from your reports, you’ll be able to identify characteristics related to leads that have the highest conversion potential and use them to develop your ideal customer profile.
- Forecast with confidence: Data-driven forecasting replaces guesswork. By analyzing your pipeline and historical data, you can predict future revenue with far greater accuracy, which helps with everything from budgeting to hiring.
How we evaluated these CRM reporting platforms
Choosing the right CRM reporting software requires looking beyond marketing claims to examine real-world performance. Our evaluation process combined hands-on testing, analysis of user reviews from G2, Capterra, and TrustRadius, and detailed examination of each platform’s documentation.
Our evaluation criteria:
1. Reporting customization
We assessed how easily users can create custom reports tailored to their specific business needs. Can you filter by custom fields? Save report templates? Build reports without technical expertise?
2. Real-time capabilities
We tested how quickly each platform updates data and whether dashboards reflect current pipeline status or yesterday’s snapshot.
3. Ease of use
We evaluated the learning curve for new users and whether sales managers can generate insights without IT support.
4. Forecasting accuracy
We examined the sophistication of each platform’s revenue forecasting tools and whether they account for deal probability, sales cycle length, and historical trends.
5. AI and automation features
Given that 70% of companies now use AI in their CRM, we evaluated which platforms offer predictive analytics, automated insights, and intelligent recommendations.
6. Integration capabilities
We assessed how well each CRM’s reporting connects with other business tools like email, marketing automation, and business intelligence platforms.
7. Value for money
We compared reporting features available at each price tier to identify which platforms deliver the most capability per dollar spent.
8. Rating methodology
Our ratings (out of 5.0) reflect weighted scores across these criteria, with particular emphasis on customization and ease of use—the two factors that determine whether teams actually use reporting features.
We also incorporated aggregate user satisfaction scores from independent review platforms, focusing specifically on feedback about reporting and analytics capabilities.
6 CRMs with the best sales data reporting tools and features
Discover our selection of the top six CRMs known for their exceptional reporting features. These platforms offer powerful analytics to help you make informed decisions and boost productivity.
CRM reporting platforms compared
1. Nutshell
Rating: 4.8/5
Best for: Customizable sales reporting with real-time insights across the entire sales cycle
Quick summary
Nutshell’s reporting approach centers on one core principle: customization without complexity. Sales teams can quickly access the insights that matter most to them—from lead sources to revenue forecasting to individual rep performance—and filter data by virtually any variable without requiring technical expertise. The platform delivers real-time updates, ensuring managers always see current pipeline status rather than yesterday’s snapshot.
Key features
- Custom report builder: Create and save reports based on any combination of filters, fields, and date ranges—without coding or IT support
- Real-time dashboards: Access up-to-the-minute data on pipeline health, team performance, and revenue projections that update automatically as deals progress
- Snapshot reports: Visualize trends over time with charts showing pipeline growth, win rate evolution, and sales cycle length changes
- Sales report: Comprehensive overview comparing current performance against previous periods across all key metrics
- Activity tracking: Monitor customer touches by rep and correlate activity levels with actual sales results to identify coaching opportunities
- Forecast accuracy: Project revenue based on pipeline value, deal probability, and historical close rates—with confidence levels built in
Pros
- Intuitive customization: Sales managers can build sophisticated custom reports in minutes without technical training or support tickets
- Time-saving automation: Automated data logging and one-click report generation save teams five to ten hours per week previously spent on manual reporting
- Affordable pricing tiers: Comprehensive reporting features available starting at $13 per month, with advanced capabilities at $42 per month—significantly lower than enterprise platforms
Cons
- Learning curve for advanced features: While basic reporting is intuitive, mastering all customization options takes time and exploration
- Limited predictive AI: Lacks some of the advanced AI-powered forecasting capabilities found in enterprise platforms like Salesforce
- Report sharing options: Exporting and scheduling automated report delivery could be more robust for stakeholder communication
Pricing
Nutshell’s Foundation plan starts at $13 per month and includes comprehensive sales reports and new leads reports. The Pro plan costs $42 per month and adds snapshots, activity reports, losses tracking, funnel analysis, and the custom report builder—delivering enterprise-level reporting at mid-market prices.
Related: How is Nutshell different than Copper?
Reporting & analytics in Nutshell
Learn more about Nutshell’s reporting and analytics features!
2. Salesforce
Rating: 4.6/5
Best for: Enterprise-level advanced analytics with unlimited customization potential
Quick summary
Salesforce offers the most powerful and comprehensive reporting capabilities on this list—if you’re willing to invest time mastering the platform. The CRM’s reporting engine can answer virtually any business question through custom formulas, matrix reports, joined reports, and a sophisticated report builder. For enterprises with dedicated CRM administrators and complex reporting needs, Salesforce delivers unmatched depth.
Key features
- Mobile reporting: Access full reporting functionality from iOS and Android devices for on-the-go insights
- Advanced report builder: Create complex reports using custom formulas, cross-object relationships, and conditional logic to answer sophisticated business questions
- Dashboard customization: Build visual dashboards with up to 20 components showing real-time metrics across your entire revenue operation
- Einstein Analytics: AI-powered insights surface hidden patterns, predict outcomes, and recommend actions based on your historical data
- Report scheduling: Automate report generation and distribution to stakeholders on custom schedules
Pros
- Unlimited customization: If you can imagine a report, Salesforce can build it—no limitations on complexity or data relationships
- Scalable architecture: Handles enterprise data volumes and user counts without performance degradation
- Ecosystem integration: Connects seamlessly with thousands of third-party analytics tools and business intelligence platforms for extended capabilities
Cons
- Steep learning curve: Building advanced reports requires training and often dedicated administrator support
- Premium pricing: Basic reporting starts at $25 per month, but accessing advanced analytics features requires significantly higher-tier plans
- Overwhelming for small teams: The platform’s power comes with complexity that small businesses may find excessive for their needs
Pricing
Salesforce Sales Cloud starts at $25 per month with basic reporting and analytics features. However, advanced capabilities like Einstein Analytics, custom report formulas, and sophisticated dashboards typically require Professional ($80 per month) or Enterprise ($165 per month) tiers. À la carte pricing for premium features can significantly increase total costs.
Related: Five Reasons People Don’t Leave Salesforce—Even When They Want To
3. HubSpot CRM
Rating: 4.4/5
Best for: Free forecasting capabilities and competitive team tracking through rep leaderboards
Quick summary
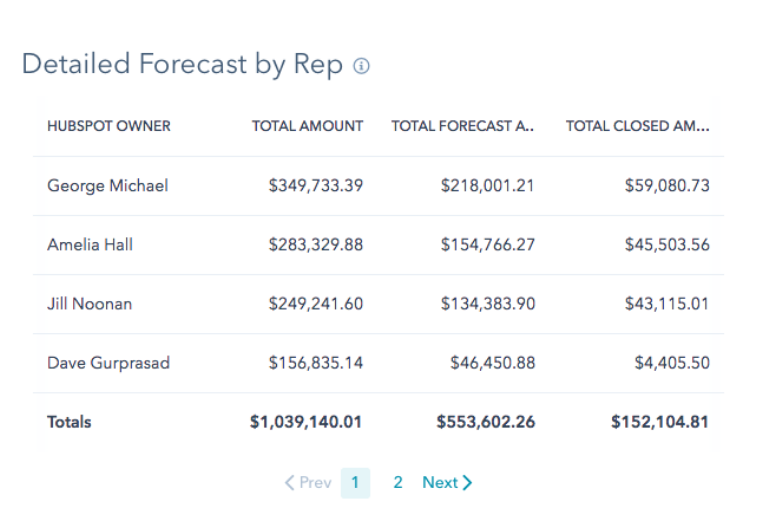
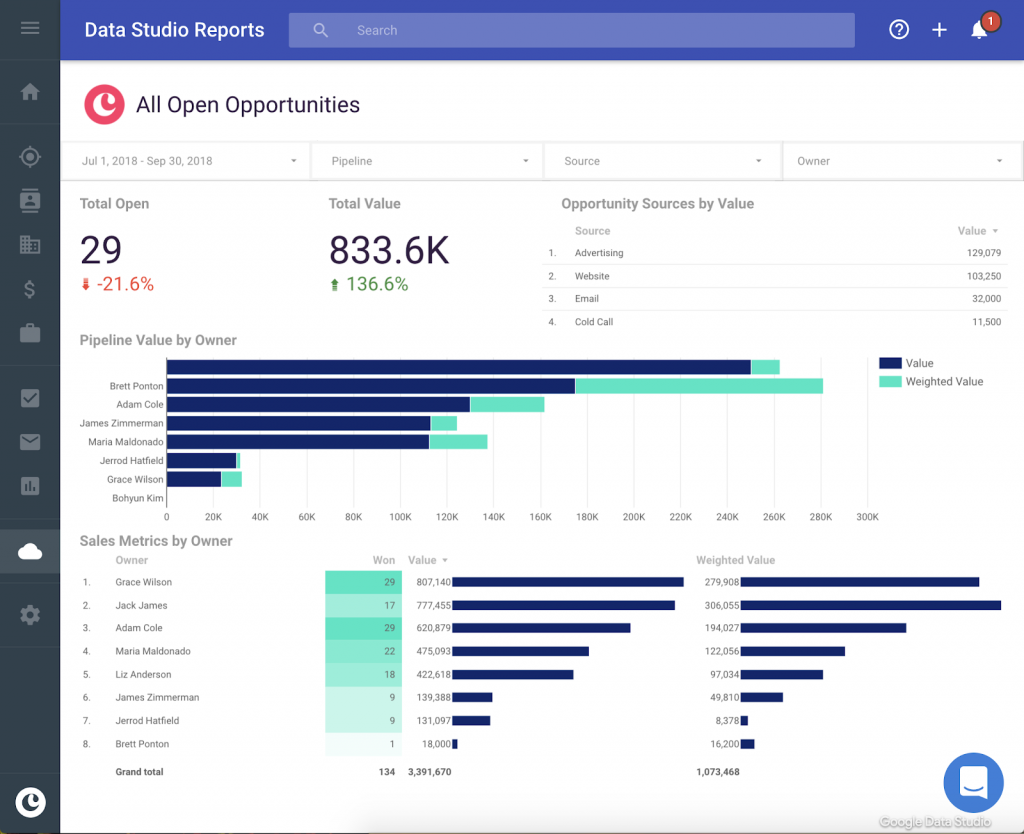
HubSpot CRM stands out by offering surprisingly robust forecasting and reporting features in its free tier—a rarity in the CRM market. The platform calculates revenue forecasts based on deal stage probability, provides visual pipeline reports, and includes a unique rep leaderboard feature that gamifies sales performance. For teams seeking powerful reporting without upfront investment, HubSpot delivers exceptional value.
Key features
- Free forecasting reports: Generate revenue forecasts based on weighted deal pipeline probability without paying for premium tiers
- Rep leaderboard: Visualize which sales reps are closest to closing deals and hitting quotas, creating healthy competition
- Deal source tracking: Analyze which lead sources generate the most revenue and highest conversion rates
- Sales performance dashboard: Monitor team progress toward goals with visual charts showing deals created, won, and in progress
- Custom report builder: Create tailored reports filtering by deal properties, contact attributes, and custom fields (available on paid plans)
Pros
- Generous free tier: Access core forecasting and pipeline reporting without spending a dollar—ideal for startups and small teams
- User-friendly interface: Intuitive design makes report creation accessible even for non-technical users
- Marketing integration: Unified platform connects sales and marketing data for complete funnel visibility and attribution reporting
Cons
- Advanced features require paid plans: Custom reporting, productivity reports, and detailed analytics are locked behind the $90 per month Professional tier
- Limited customization in free tier: Free users can’t build custom reports or access advanced filtering options
- Report export limitations: Exporting data and scheduling automated report delivery requires premium subscriptions
Pricing
HubSpot’s free CRM includes basic forecasting and pipeline reports permanently at no cost. The Sales Hub Professional plan starts at $90 per month and unlocks custom reporting, productivity dashboards, and advanced analytics. The Enterprise tier ($150 per month) adds additional customization options and reporting flexibility.
Related: How is Nutshell different than HubSpot?
4. Copper
Rating: 4.2/5
Best for: Goal-focused sales teams deeply integrated with Google Workspace
Quick summary
Copper’s reporting philosophy revolves around goal setting and accountability. The platform features a dedicated goals dashboard where managers set targets for revenue, opportunities won, lead conversions, and activities—then track team progress in real time. For organizations already using Google Workspace, Copper’s native integration makes reporting feel seamless and familiar.
Key features
- Goals dashboard: Set and monitor revenue targets, opportunity goals, lead conversion quotas, and activity benchmarks for individual reps or entire teams
- Visual progress tracking: See at-a-glance how close each rep is to hitting their goals with progress bars and percentage indicators
- Forecast reports: Compare projected revenue (based on weighted pipeline value) against actual closed business to assess quota attainment likelihood
- Activity reports: Track the quantity and quality of customer interactions to identify coaching needs and best practices
- Google Workspace integration: Reports pull data directly from Gmail, Google Calendar, and Google Drive without manual data entry
Pros
- Goal-oriented approach: Built-in goal tracking keeps teams focused on what matters most and creates accountability
- Seamless Google integration: For teams living in Google Workspace, Copper feels like a native Google product with automatic data sync
- Minimal manual data entry: Automatic activity logging from Gmail and Calendar keeps records complete without rep effort
Cons
- Limited to Google ecosystem: Teams using Microsoft 365 or other platforms miss much of Copper’s value proposition
- Basic customization: Report customization options are more limited compared to platforms like Nutshell or Salesforce
- Higher pricing for advanced features: Comprehensive reporting requires the $99 per month Business plan—significantly more than the $23 Basic tier
Pricing
Copper’s Basic plan starts at $23 per month and includes fundamental sales reporting tools. The Business plan costs $99 per month and unlocks activity reports, lead insights, sales analytics, and goal tracking—the features that make Copper’s reporting truly valuable.
Related: How is Nutshell different than Copper?
5. Pipedrive
Rating: 4.0/5
Best for: Advanced sales forecasting for data-driven teams
Quick summary
Pipedrive built its reputation on visual pipeline management, and that strength extends to its reporting capabilities. The platform excels at forecasting future revenue by analyzing historical deal closure patterns and applying probability weights to current opportunities. Sales managers who need confident revenue predictions to guide hiring, budgeting, and resource allocation will appreciate Pipedrive’s sophisticated forecasting engine.
Key features
- Advanced revenue forecasting: Predict future revenue based on historical win rates, current pipeline value, and deal-specific close probabilities
- Visual pipeline reports: See exactly where deals cluster in your sales process and identify stages with unusual drop-off rates
- Conversion rate tracking: Monitor how well leads progress between pipeline stages to pinpoint conversion bottlenecks
- Time-based filtering: Generate reports for custom date ranges (quarters, months, weeks) and compare performance across periods
- Rep-level breakdowns: Analyze individual sales rep performance to identify top performers and those needing support
Pros
- Forecasting accuracy: Historical data analysis and probability weighting deliver more reliable revenue projections than simple pipeline totals
- Visual clarity: Pipeline visualization makes complex sales data immediately understandable even for non-technical stakeholders
- Affordable entry point: Essential reporting features available at $14 per month—competitive for the value delivered
Cons
- Limited report customization: Creating truly custom reports requires workarounds or third-party integrations
- Premium features expensive: Advanced forecasting is only available on the $49 per month Professional plan—not the entry-level tier
- Activity reporting gaps: Tracking and reporting on sales activities (calls, meetings, emails) is less robust than dedicated features in Nutshell or Salesforce
Pricing
Pipedrive’s Lite plan starts at $14 per seat per month with basic pipeline reports and conversion tracking. The Premium plan costs $59 per seat per month and unlocks the platform’s advanced revenue forecasting capabilities—the feature that sets Pipedrive apart.
Related: How is Nutshell different than Pipedrive?
6. NetHunt CRM
Rating: 3.8/5
Best for: Gmail-native reporting for teams living in their inbox
Quick summary
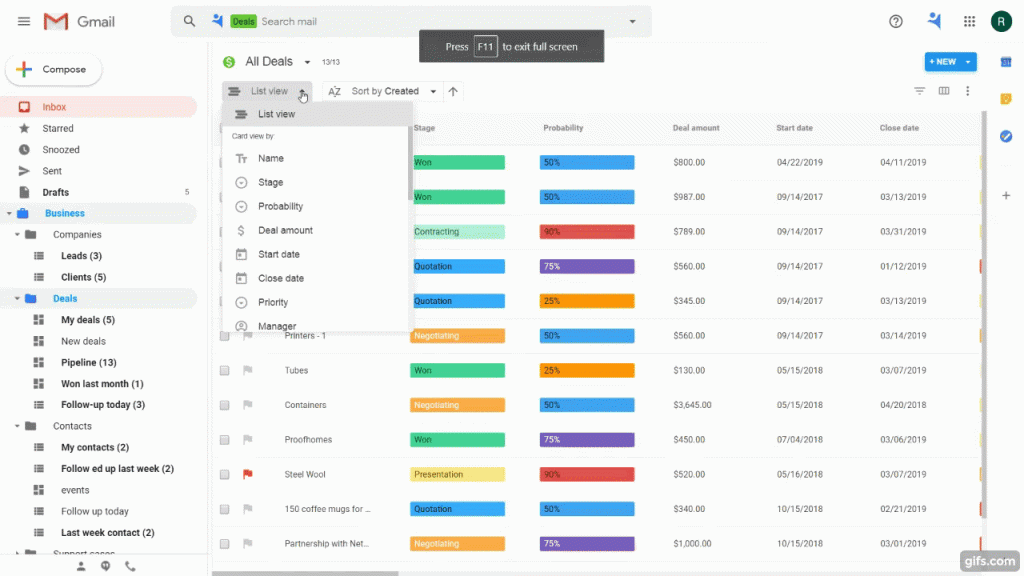
NetHunt CRM takes a unique approach: instead of forcing users to leave Gmail, it brings CRM reporting directly into the inbox. For sales teams who spend their entire day in Gmail and Google apps, NetHunt eliminates context switching by generating reports from data already flowing through their email. The platform’s filter-based report builder allows teams to slice data by virtually any criterion without complex configuration.
Key features
- Gmail-embedded reporting: Access CRM reports directly within Gmail without opening separate tabs or applications
- Flexible filter system: Build custom reports by combining multiple filters (deal stage, priority level, date range, custom fields) for precise data analysis
- Google Sheets integration: Export report data directly to Google Sheets for additional analysis or stakeholder sharing
- Pipeline visualization: View deals organized by stage with drag-and-drop functionality to update records while analyzing data
- Activity tracking: Monitor email interactions, meeting schedules, and task completion rates pulled automatically from Google Workspace
Pros
- Zero context switching: Sales reps never leave Gmail to access reports, check pipeline status, or analyze performance
- Automatic data capture: Email interactions, calendar events, and document sharing automatically populate CRM records without manual entry
- Intuitive for Gmail users: If your team already knows Gmail, they already understand 80% of NetHunt’s interface
Cons
- Limited to Google ecosystem: Teams using Outlook, Apple Mail, or other platforms can’t leverage NetHunt’s core value proposition
- Smaller platform: Fewer integration options and third-party apps compared to established platforms like Salesforce or HubSpot
- Basic analytics: Reporting capabilities are functional but less sophisticated than enterprise platforms—lacks predictive analytics and AI-powered insights
Pricing
NetHunt offers a free plan with limited features. The Business plan starts at $24 per month and provides access to campaign analytics, custom reporting, and integrations like Zapier that extend reporting capabilities beyond native features.
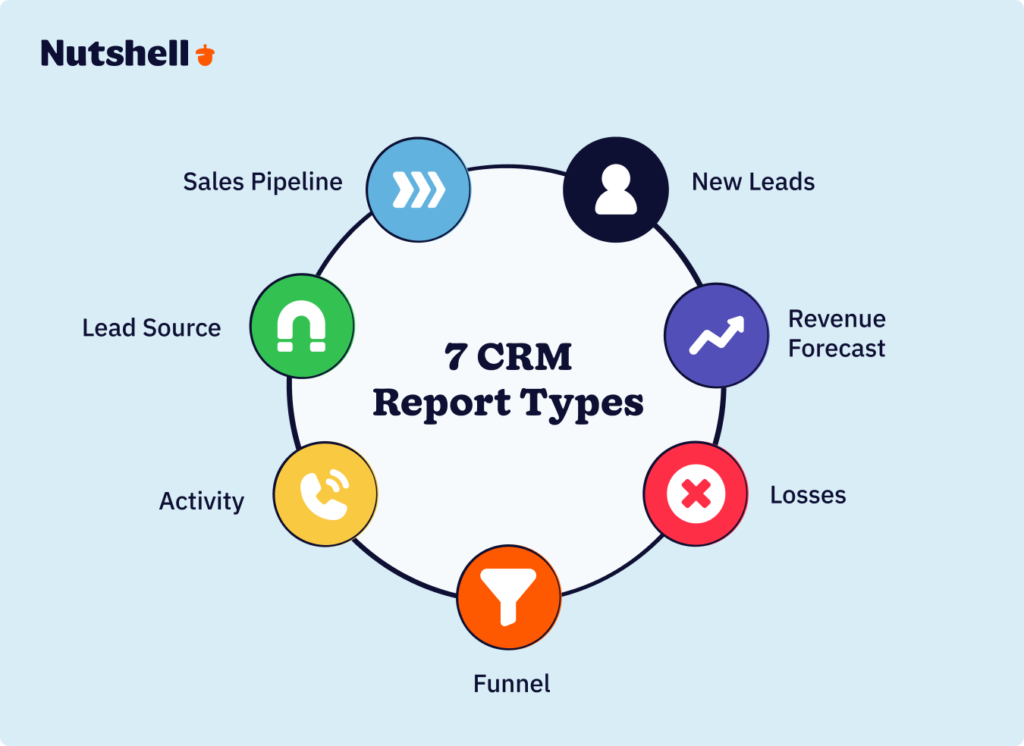
Types of CRM reports
There are countless types of CRM reports out there, but not all of them are necessarily going to help you. However, there are a handful that you should be aware of. We’ll cover them below, examining each one and how it can help you.
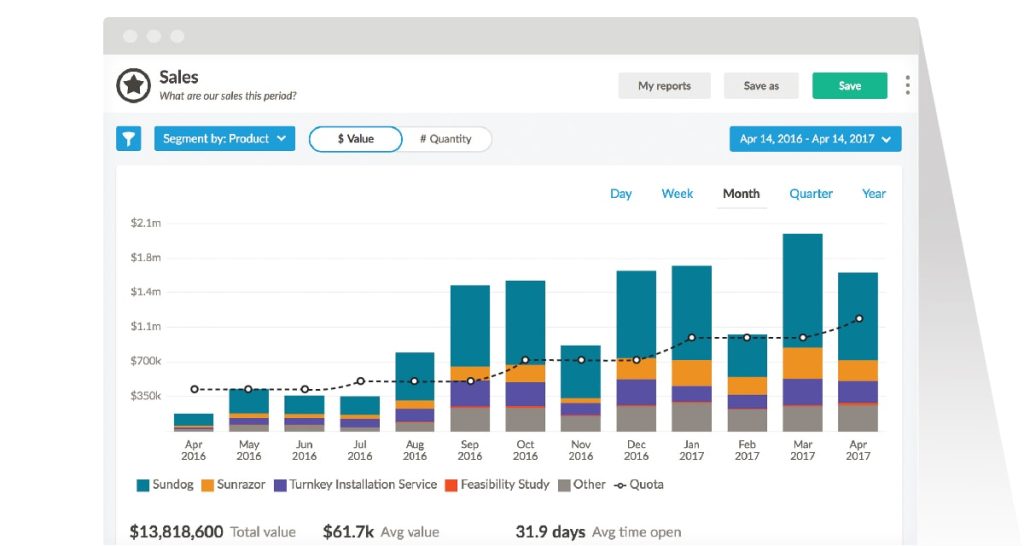
1. Sales pipeline report
Almost any good CRM with sales reporting features should include a sales pipeline report. This type of report looks at your overall sales performance for a given period. It does so by examining metrics like conversion rate and the number of deals in each stage of your pipeline.
This report is valuable because it gives you a very basic, straightforward look at whether your marketing has been successful—more specifically, whether you’re earning revenue and, if so, how much.
You can use this report to help you see where your sales process is struggling so you can improve it. For example, you may see that your conversion rate is staggeringly low for a particular location. You can then revamp your marketing for that location to drive more sales.
2. New leads report
A new leads report looks at exactly what it sounds like—how many new leads you’re earning over a specified period. Driving leads is crucial because, without leads, you won’t have anyone to convert.
In addition to helping you monitor your lead volume (that is, how many leads you currently have in your pipeline), a new leads report lets you segment your leads to see how many leads you’re earning from each individual source.
A new leads report is great for insights into your top-of-funnel marketing effectiveness. Maybe you have a high sales rate, but you’re not generating many new leads. That tells you your bottom-of-funnel marketing is fine, but your top-of-funnel content needs more work.
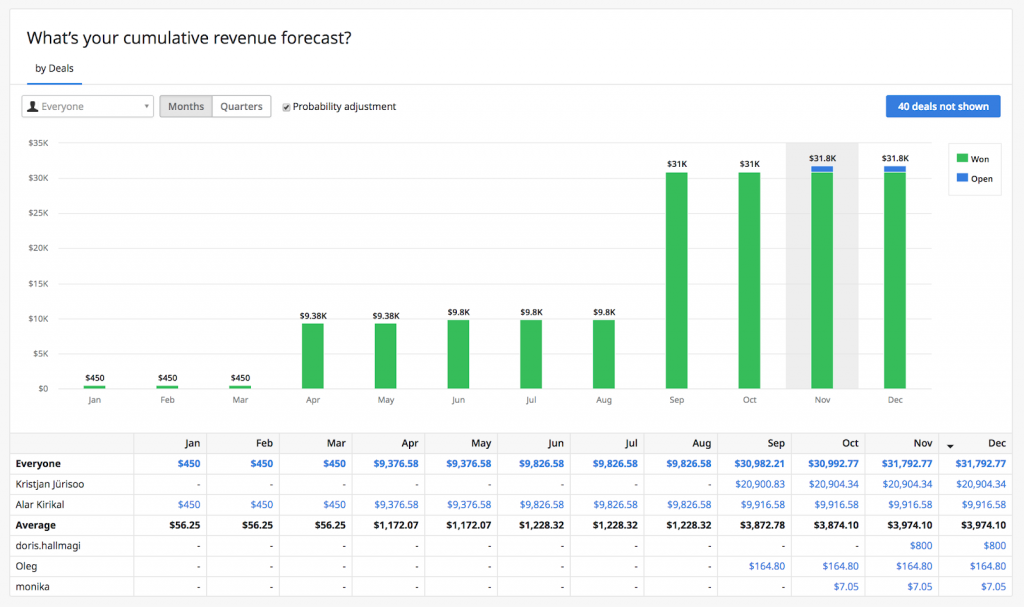
3. Revenue forecast report
A revenue forecast report gives you a look at the amount of revenue you’re expected to earn in the near future based on your current metrics. Naturally, this measurement is only an estimate, but it’s still worth looking at when you’re trying to plan for your budget and sales going forward.
You can typically adjust revenue forecast reports based on how far ahead you want to predict and by confidence level. A high confidence level focuses only on the amount of revenue your CRM is confident you can earn, while a low confidence level also accounts for potential revenue that’s less certain.
Learning this information is a simple way to see if you’re on track to meet your revenue goals. If you’re expected to earn far less revenue than you’d planned, for instance, you’ll want to reevaluate your budget and probably revamp some of your marketing to drive more sales.
4. Losses report
Yet another vital type of CRM reporting feature is the losses report. A losses report shows you an overview of all the sales opportunities you’ve lost within a given time. That happens whenever a lead goes with a competitor or simply decides not to buy from you.
As disappointing as it is to look at all the sales you’ve missed out on, it can teach you quite a lot. These reports do more than simply show you how many sales you’ve lost—they show you why you’ve lost them.
You can segment your reports by groups to see which are most heavily affected. That will give you insights into what factors are causing you to lose sales—for instance, if most of your losses are happening around one particular product, you know you should assess the product’s weaknesses or its marketing.
5. Funnel report
A funnel report is similar to a standard sales pipeline report. However, the main difference is that a funnel report considers both sales and leads and emphasizes how those leads progress through your sales funnel.
To understand your campaigns’ effectiveness, you can easily segment funnel reports by different marketing funnel stages. For instance, compare the number of top-of-funnel leads you have versus the number of middle-of-funnel leads you have.
By examining different lead values, you can also assess the quality of those leads in addition to their quantity. Overall, this information lets you easily compare different stages of your funnel to see which campaigns are proving the most effective and which ones need work.
6. Activity report
An activity report allows you to evaluate team performance easily.
With Nutshell’s activity report, you can filter by users or teams, select the time frame you’d like to report on, and compare activity to the previous time frame. You can even set up quotas and goals for your team, filter by logged or unlogged activities, include or exclude emails and notes with one click, and see average call/meeting duration—plus counts of AI-generated summaries and rep notes—to zero in on coaching opportunities faster.
Default click-to-call, voicemail, and video-conferencing activity types ensure every interaction is categorized automatically, while unscheduled Zoom or Google Meet sessions are logged for you, keeping your records complete.
In addition, you can connect activities to outcomes like won or lost leads, so your team can focus on actions that drive the best results.
Seamlessly save, share, and export activity reports to keep your team in the loop.
7. Lead source report
Understanding where your best leads come from is crucial for smart resource allocation. Lead source reports give you a clear picture of your lead generation landscape. You’ll see which channels are bringing in the most qualified leads, how different sources convert, and where you’re getting the best return on your marketing investment.
This insight helps you double down on what’s working and cut back on what isn’t. With proper lead source tracking, you can make informed decisions about where to allocate your marketing budget for maximum impact.
Fun fact: 91% of businesses report a decrease in their customer acquisition costs after implementing proper CRM reporting, with nearly half seeing reductions between 11% and 20%.
Here’s a table summarizing the various types of CRM reports discussed above.
CRM reporting types Key CRM report attribute Sales pipeline report Assesses overall sales performance for a specific period. New leads report Tracks the number of new leads generated in a given timeframe. Revenue forecast report Projects expected revenue based on current metrics. Losses report Provides an overview of lost sales opportunities over a set period. Funnel report Examines the progression of leads through the sales funnel. Activity report Evaluates team performance, tracks their activities, and links effort to outcomes. Lead source report Optimizes marketing spend and effort. How to choose the right CRM reporting software for your business
Selecting CRM reporting software requires matching capabilities to your specific needs rather than choosing the “best” platform in a vacuum. Use this decision framework to identify which features matter most for your situation.
Step 1: Assess your team size and complexity
- Small teams (one to ten reps): Prioritize ease of use and affordability. Platforms like Nutshell and HubSpot CRM deliver powerful reporting without overwhelming small teams with unnecessary complexity. Look for pre-built report templates and intuitive dashboards that new users can understand immediately.
- Mid-sized teams (ten to 50 reps): Focus on customization and scalability. You need reporting that grows with your business—the ability to create custom reports, track team performance individually, and forecast accurately as deal volume increases. Nutshell, Pipedrive, and Copper excel in this range.
- Enterprise teams (50+ reps): Demand advanced analytics, unlimited customization, and enterprise-grade integrations. Salesforce becomes compelling at this scale despite its complexity, as dedicated administrators can unlock capabilities smaller platforms simply don’t offer.
Step 2: Define your critical reports
Ask yourself: “What decisions do we make regularly that require data?” Your answer determines which reporting features are non-negotiable.
- If you primarily need pipeline visibility and forecasting: Pipedrive, Nutshell, and HubSpot all deliver strong forecasting capabilities at accessible price points.
- If you need to track marketing attribution and ROI: Choose platforms with robust lead source tracking and marketing integration—Nutshell, HubSpot, and Salesforce lead here.
- If your focus is rep coaching and performance management: Prioritize activity reporting and individual performance dashboards. Nutshell’s activity reports and Copper’s goal tracking excel in this area.
- If you require custom reports for unique business models: Salesforce and Nutshell offer the deepest customization options, though Salesforce requires more technical expertise.
Step 3: Evaluate technical requirements
- Google Workspace users: Copper and NetHunt CRM provide native Google integration that eliminates duplicate data entry and context switching.
- Microsoft 365 users: Focus on platforms with strong Outlook integration and Microsoft ecosystem compatibility.
- Teams requiring mobile access: Verify that your chosen platform offers full reporting functionality on mobile devices, not just basic CRM access.
- Integration needs: If you use specific marketing automation, business intelligence, or accounting tools, confirm that your CRM reporting integrates seamlessly.
Step 4: Consider budget constraints
CRM reporting costs vary dramatically, and more expensive doesn’t always mean better for your needs.
- Budget-conscious (under $25 per user per month): HubSpot’s free tier, Nutshell’s Foundation plan ($13 per month), and Pipedrive’s Essential plan ($14 per month) deliver solid reporting without breaking the bank.
- Mid-market (25−75 per user per month): Nutshell Pro ($42 per month), Copper Business ($99 per month), and Pipedrive Professional ($49 per month) offer advanced features at reasonable prices.
- Enterprise (over $75 per user per month): Salesforce and HubSpot’s premium tiers provide maximum capabilities but require significant investment.
Important consideration: Factor in the total cost of ownership, including implementation time, training requirements, and potential administrator salaries. A “cheap” CRM that requires extensive customization may cost more long-term than a more expensive platform that works immediately.
Step 5: Test before committing
Nearly every platform on this list offers free trials. Use them strategically:
- Import a representative sample of your actual data
- Generate the three to five reports you’ll use most frequently
- Ask your sales reps to use the platform for one full sales cycle
- Evaluate whether insights are actionable or merely interesting
The right CRM reporting software makes data-driven decisions faster and easier. The wrong one creates another source of frustration and wasted time.
Key features to consider in CRM sales reporting and analytics
When sourcing a CRM solution for your organization, you want software that can support your sales, marketing, and customer support processes and provide in-depth reports for effective analysis. To ensure you invest in the best possible CRM system, consider the following integral reporting features:
- One-click standard reports: Look for a CRM that offers clear analytical reports right out of the box and the ability to create more complex reports according to your needs.
- Snapshot reports: Check whether the platform offers snapshot reports that give you a quick overview of trends and how your business is evolving over time.
- Email reports: Modern CRM solutions like Nutshell include email marketing tools, which means you’ll need to draw email reports to see how leads and customers engage with the messages your team is sending out
- Custom reports: Ensure your CRM lets you create custom reports that show you the metrics that are most important to you, and that it supports SQL access for more advanced reporting.
- App integrations: Find a CRM system that facilitates integrations with third-party analytics tools like Google Analytics, Google Ads, and other software important to your business to pool data from critical sources for comprehensive and accurate reporting.
- Segments and filters: Your CRM should provide robust filtering and segmentation options, allowing you to zero in on specific data for further analysis.
- Save and share: Make sure you can easily save your standard and custom reports and share them with colleagues and other stakeholders.
- Download or export: The ability to download and export your reports into a spreadsheet for custom analysis is highly beneficial and something to look out for.
Frequently asked questions
1. What’s the most important CRM report for sales teams?
While needs vary by business, the sales pipeline report is often considered the most crucial. It gives you real-time visibility into deal progression and helps identify bottlenecks in your sales process. That said, the best report is the one that answers your most pressing business questions.
2. How often should I review my CRM reports?
Different reports require different review frequencies:
- Daily: Activity reports and pipeline updates
- Weekly: Sales forecasts and team performance
- Monthly: Lead source effectiveness and loss analysis
- Quarterly: Trend analysis and strategic planning
Remember, the goal is to spot trends and make adjustments before issues impact your bottom line.
3. Can CRM reports really improve sales performance?
Absolutely. The data shows that CRM applications can increase sales by up to 29% and boost sales productivity by up to 34%. The key is using the reports to make data-driven decisions rather than just collecting data.
4. How do I know if I’m tracking the right metrics?
Start by identifying your key business objectives. If you’re focused on growth, track lead generation and conversion rates. If retention is your goal, monitor customer satisfaction and engagement metrics. The right metrics are those that directly tie to your business goals.
5. What’s the ROI of implementing CRM reporting?
Studies show the average return on CRM investment is $8.71 for every dollar spent. Additionally, 91% of businesses report a decrease in customer acquisition costs after implementing CRM reporting, with many seeing reductions of 11-20%.
6. How can I get my team to actually use CRM reports?
Success comes down to three factors:
- Make it easy: Choose a user-friendly CRM with intuitive reporting
- Make it relevant: Focus on reports that directly help your team sell better
- Make it routine: Build report reviews into your regular sales meetings
7. Should I use standard or custom reports?
Start with standard reports to establish baseline metrics, then create custom reports as you identify specific needs. Most teams find a mix of both works best – standard reports for common metrics and custom reports for unique business requirements.
Looking for an easy-to-use CRM with all the features you need to boost sales?
Nutshell has what you’re looking for. Take our guided tour to explore Nutshell’s incredible features!
Choose the best CRM software for your sales reporting needs
When looking for a new CRM, you should always start by determining what your team needs the most. Does the software easily uncover the metrics that are most important to you?
If you’re all about forecasting and ensuring your team is hitting its targets, you may want to look for a CRM specializing in these features, like Copper. However, if you’re after a CRM that does a lot of the number-crunching for you and is completely customizable, a tool like Nutshell will be a better fit for your needs.
Not all CRMs are built the same. Some are super easy to use but lack the advanced tools a sales team needs to identify bottlenecks in their pipeline or see which reps are performing better than others. Take the time to figure out which CRM is the best fit for your reporting and analytics needs. After all, it’s a crucial tool that can supercharge your sales team’s success.
Pssst! Do you think Nutshell is the right CRM for your team? Take it for a test spin with our 14-day free trial! You’ll be able to explore our powerful CRM platform and discover if it’s the right fit for your company.
CRM reporting frequently asked questions
-
What’s the difference between a CRM dashboard and a CRM report?
Dashboards show real-time data visually (charts, graphs) for quick daily insights and at-a-glance monitoring. Reports provide detailed, static analysis of historical data for deeper dives into trends and patterns. Think of dashboards as your live scoreboard, while reports are your post-game analysis.
-
Can I customize CRM reports to track my specific business metrics?
Yes. Modern CRMs like Nutshell let you build custom reports by selecting your metrics, applying filters, and choosing visualizations. You can track territory sales, product performance, or any field in your database—then save and share those reports with your team for consistent tracking.
-
How do I automate CRM reports to save time?
Most CRMs offer scheduled reporting that automatically generates and emails reports at your chosen frequency—daily, weekly, monthly, or quarterly. Set your date range, recipients, and delivery schedule once, and your CRM handles the rest. This eliminates manual report creation and ensures stakeholders stay informed.
-
Should I use Excel or CRM software for sales reporting?
Excel works for basic tracking with small teams, but CRMs offer real-time updates, automation, team collaboration, and secure cloud storage. As your business grows, Excel becomes error-prone and time-consuming. CRMs scale with you, providing deeper insights without manual data entry or version control issues.
-
Can I share CRM reports with team members who don’t use the CRM?
Absolutely. You can export reports as PDFs or CSV files, share live dashboard links, or schedule automatic email delivery to any stakeholder. Many CRMs let you set view-only access or password-protect reports, ensuring non-users get the insights they need without requiring a full CRM license.

Ready to see Nutshell in action?
Attend a live guided tour!
- Every Wednesday at 10am ET/7am PT
- Every Tuesday & Thursday at 3pm ET/12pm PT
 BACK TO TOP
 Written by
 Cody Slingerland Senior Contributor, Sell to WinEdited by
 Will Gordon Sr. Director of MarketingReviewed by
 Andy Fowler CEO & Co-Founder, Nutshell
Ready to try
Nutshell for Free?Thank you! Your submission has been received!Oops! Something went wrong while submitting the form.


What Are the Top 3 Go-To-Market Strategies?
Published on: November 10, 2022Sales Performance Reviews: 9 Tips to Make Them Valuable
Published on: November 10, 2022Join 30,000+ other sales and marketing professionals. Subscribe to our Sell to Win newsletter!